


We share the Weekly Gamma Bands Update by Viking Analytics. The report uses options gamma to help you better manage risk and your equity allocations.
The S&P 500 (SPX) closed 5 points lower last week and 55 points under the gamma flip level. Below the gamma neutral level, volatility tends to be higher as rallies are bought and dips are sold by delta hedging algorithms.
Our gamma band model enters the week with a 30% allocation to the SPX. The model will move to a full allocation if the market rises and closes above the gamma flip level, currently near 3,895. This model will fall to a 0% allocation if SPX closes below the lower gamma level currently near 3,725.
The chart below shows how price (in black) relates to the gamma flip (in blue) and the lower gamma level (in red). The indicator below the price chart shows the daily positioning allocations.
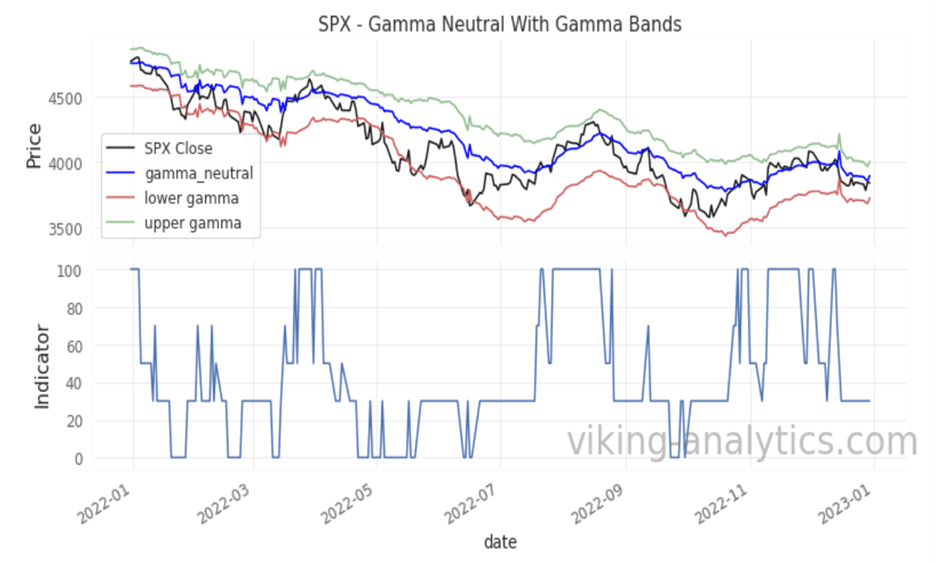
The Gamma Band model[1] can be viewed as a trend following model that is shows the effectiveness of tracking various levels of market gamma. When the daily price closes below Gamma Flip level, the model will reduce exposure to avoid price volatility and sell-off risk. There is also an allocation adjustment whether the trend of gamma flip is positive or negative. If the market closes below what we call the “lower gamma level,” the model will reduce the SPX allocation to zero.
The main premise of this model is to maintain high allocations to stocks when risk and corresponding volatility are expected to be low. For investors who have been conditioned to “buy low and sell high,” it is counter-intuitive to increase allocations when the market rises, but this approach has shown to increase risk-adjusted returns in the back-test.
Risk management tools like this have become more important than ever to manage drawdowns like the one we are currently in. The Gamma Band model is one of several indicators that we publish daily in our SPX Report (click here for a sample report). Please visit our website to learn more about our trading and investing tools.
The Gamma Flip – Background
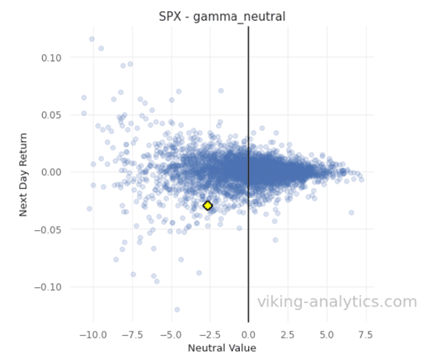
Many market analysts have noted that daily volatility in the S&P 500 will change when the value of the SPX moves from one gamma regime to another. Some analysts call this level the “gamma flip.” The scatterplot below shows how price volatility (on the y-axis) is increasingly lower as the value of SPX rises higher above the Gamma Neutral level (on the right side of the chart). When the value of the S&P closes lower than Gamma Neutral (to the left of the chart), volatility increases.
Gamma Band Model – Background
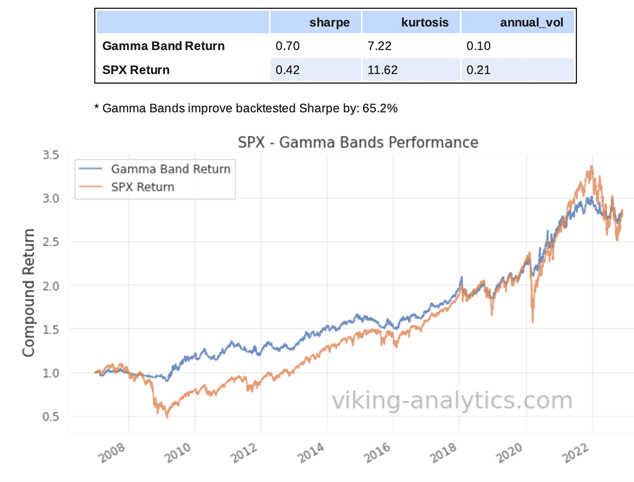
The purpose of the Gamma Band model is to show how tail risk can be reduced by following a few simple rules. The daily Gamma Band model has improved risk-adjusted returns by over 60% since 2007. The graph below demonstrates how this approach can limit drawdowns while maintaining good returns. A quick video introduction of the Gamma Band model can be seen by following this link.
Disclaimer
This is for informational purposes only and is not trading advice. The information contained in this article is subject to our full disclaimer on our website.
[1] The Gamma Band model in our SPX Market Report adjusts position size DAILY based upon the daily closing levels of SPX value and calculated Gamma Neutral. The Weekly Gamma Band model is shown for illustrative purposes only.
Authors
Erik Lytikainen, the founder of Viking Analytics, has over twenty-five years of experience as a financial analyst, entrepreneur, business developer and commodity trader. Erik holds an MBA from the University of Maryland and a BS in Mechanical Engineering from Virginia Tech.
Rob McBride has 15+ years of experience in the systematic investment space and is a former Managing Director at a multi-billion dollar hedge fund. Rob has deep experience with market data, software and model building in financial markets. Rob has a M.S. in Computer Science from the South Dakota School of Mines and Technology.

Erik Lytikainen, the founder of Viking Analytics, has over twenty five years of experience as a financial analyst, entrepreneur business developer and commodity trader. Erik holds an MBA from the University of Maryland and a BS in Mechanical Engineering from Virginia Tech. You can learn more about his work on his website: www.viking-analytics.com.