


Because Warsh doesn’t believe in forward guidance, Friday’s Jackson Hole speech may be the last window investors get into his thinking before the September 16 FOMC meeting. Accordingly, it’s worth spending more time on his speech to see if Wall Streets verdict agrees with our hawkish take in Monday’s Commentary- Warsh Makes A Hawkish Pivot.
It appears our hawkish interpretation of the speech is largely unanimous among Wall Street Analysts. Deutsche Bank called the speech a little surprising and said it “lean[ed] in a decidedly hawkish direction.” Nomura agreed, noting “the sensitivity to near-term inflation data is high” and that Warsh was “implying policy may need to react if disinflation is not occurring with speed.” Wells Fargo’s Gary Schlossberg was very direct in his interpretation. To wit,
He’s telling the market, do not expect cuts any time until we have this thing (inflation) completely under control and do prepare yourself for hikes.
A point we raised was whether the motivation behind his hawkish turn was truly inflation concerns or supporting the bond market. Tiger Brokers’ James Ooi framed Warsh’s emphasis on inflation as a credibility move:
Reinforce the Fed’s independence and credibility, reassuring markets that monetary policy will not bend to fiscal pressures
EY-Parthenon’s Gregory Daco read it similarly as an overdue inflation-credibility repair.
Both thoughts directly answer our question about the motive being “supporting the bond market.” CNBC went further politically, noting the speech “puts Warsh more clearly at odds with Trump’s demand for lower rates.”
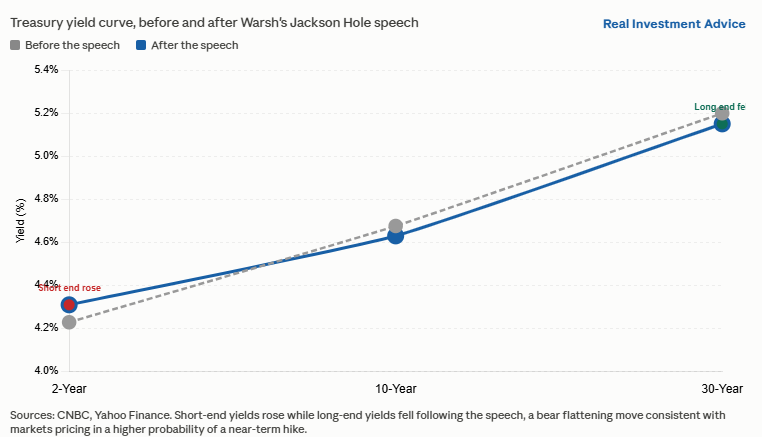
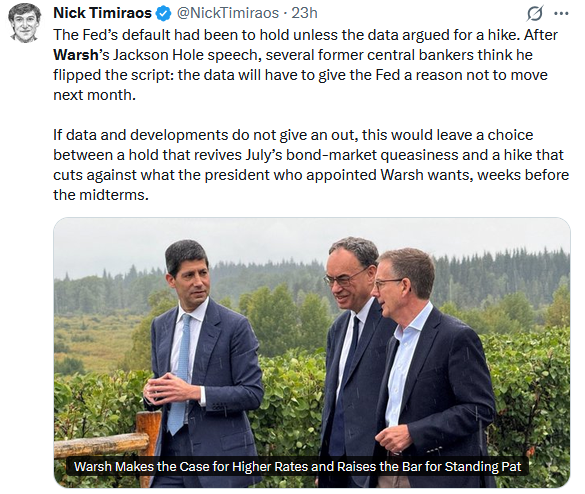
The market’s verdict matches our yield curve flattening observation. Cyrus Amini of Hyphen Wealth Management confirmed “the short end of the yield curve rose while the long end moved down,” calling it “consistent with a Fed hike.” Please see our Tweet of the Day sharing another aspect of the hawkish turn.
What To Watch Today
Earnings
Economy
Market Trading Update
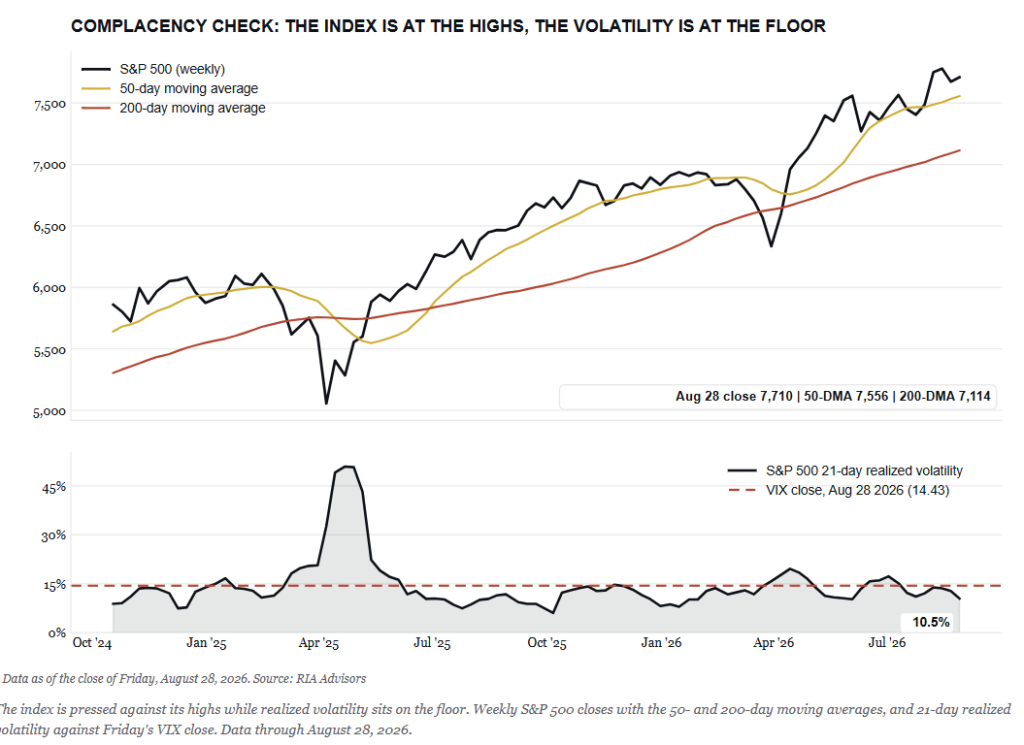
Yesterday, we noted the market sitting within a stone’s throw of its record while momentum quietly rolled over. Warsh Makes A Hawkish Pivot. Today, I want to put a price on the market complacency heading into September, because the options tape is trading as if drawdowns had been repealed.
Start with what portfolio insurance currently costs. The VIX closed Friday at 14.43, while the S&P 500’s own 21-day realized volatility was 10.5%. Four points of premium are very thin, and Goldman’s derivatives desk sharpens the point with Brian Garrett putting numbers on it. Roughly a third of the S&P carries three-month implied vol in the sub-5th percentile of a six-month lookback. Worse, forward implied pricing is under-realized for the first time in four years. A negative volatility premium isn’t a forecast. It’s the market telling you nobody wants the hedge.
The single-stock tape agrees. Cboe’s equity put/call ratio printed 0.39 on August 27 and 0.62 on Friday, with the total ratio’s nine-day average near the 13th percentile of its range. Everybody is buying calls. Nobody wants to buy puts.
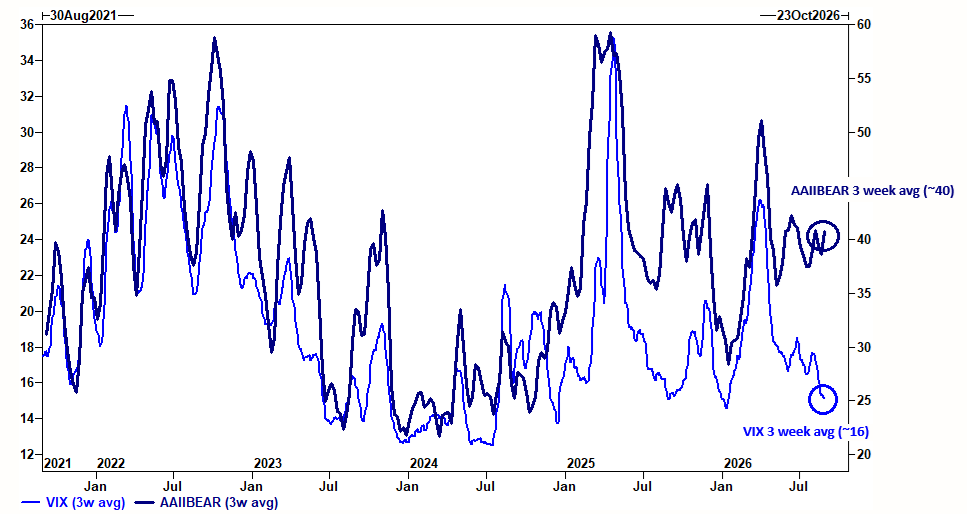
The pushback can almost write itself, with Garrett’s own work showing AAII bears above 40 alongside a VIX under 20 has been a bullish setup. It has averaged 1.1% over the following month and 2.9% over three, with roughly a 75% hit rate. Cheap volatility is not a sell signal, and I’m not treating it as one.
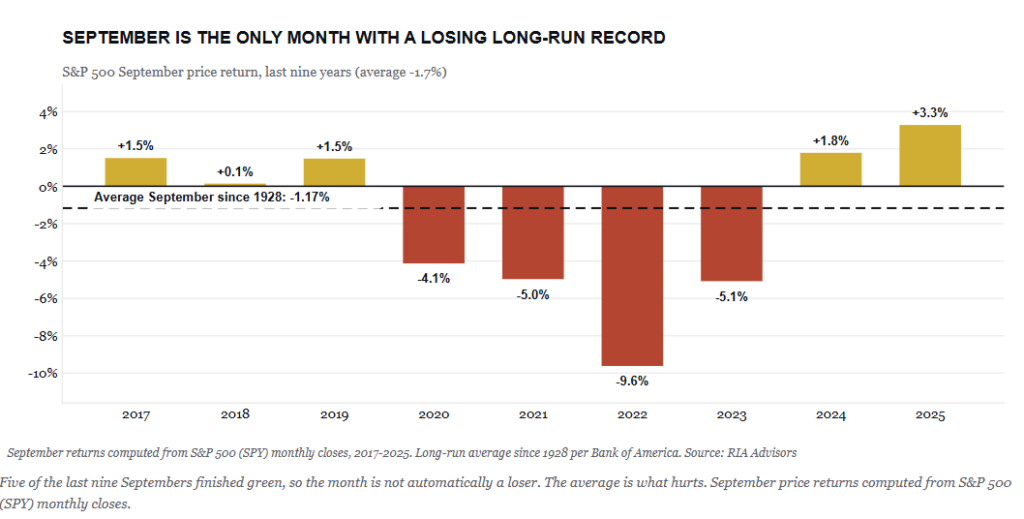
The calendar is less accommodating. Since 1928, the S&P 500 has averaged a 1.17% loss in September, per Bank of America. That’s the only month with a losing long-run record, and it finishes higher just 44% of the time. The last nine Septembers averaged a 1.7% decline.
Just for reference, the index closed Friday at 7,710, about 2% above its 50-day moving average, which is running at 7,556 and 8.4% above the 200-day at 7,114. A garden-variety reversion to the 50-day is a 2% event. A trip to the 200-day costs 8% and still leaves the bull trend intact. Neither one breaks anything, but, critically, they tend to arrive quickly, particularly in a market where investors carry almost no protection.
We don’t recommend selling into this market, at least not yet. Keep risk controls on, a larger-than-normal cash buffer, and no new exposure until the tape shows clearer intent.
What we ARE doing is taking Garrett’s conclusion literally. When implied trades under realized, hedges are marked down, and the cheapest week to buy insurance is the week nobody wants it. Rebalance winners back to target, lift portfolio quality, and put the protection on now rather than after the market makes you want it. Such is the nature of complacency. It never feels like a risk until the bill arrives.

Growth Leads The Pack
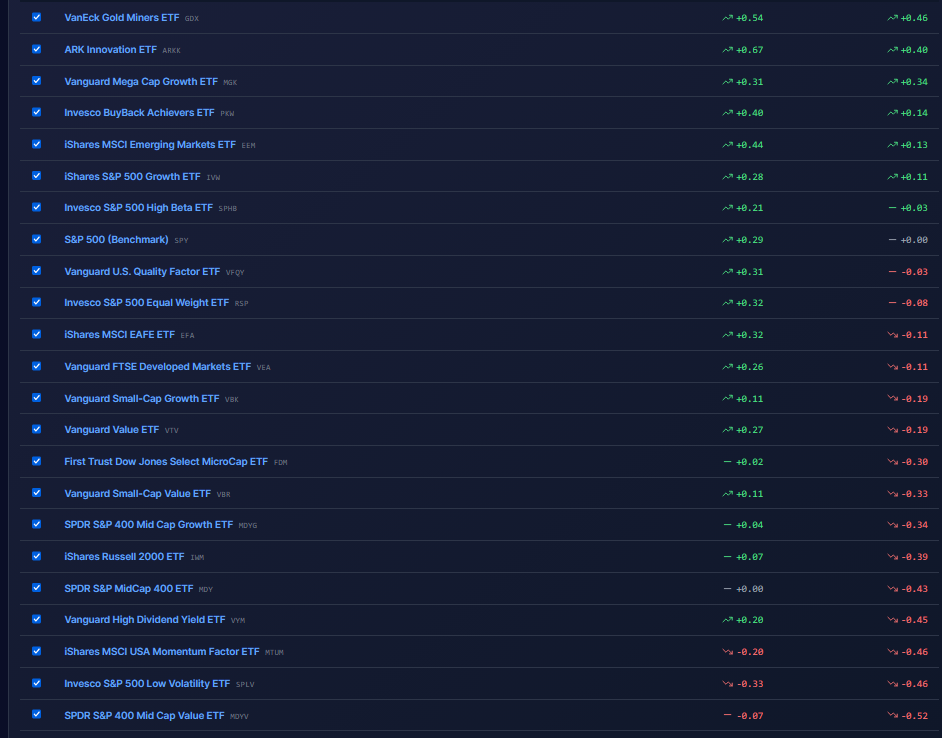
Breadth remains decent, with the relative scores and the range of scores not too far apart. That said, we are seeing signs that more speculative, growth-fueled stocks are gaining favor. For instance, ARKK, Cathie Wood’s Innovation ETF, tends to own high-beta stocks that offer the potential for substantial growth as well as high valuations has the second-highest relative score.
Smaller-cap, mid-cap, and value stocks are generally lagging the market, with relative scores below zero. However, most of their absolute scores are above zero, telling us they are likely in upward trends; thus, they are rising with the market but not keeping up.
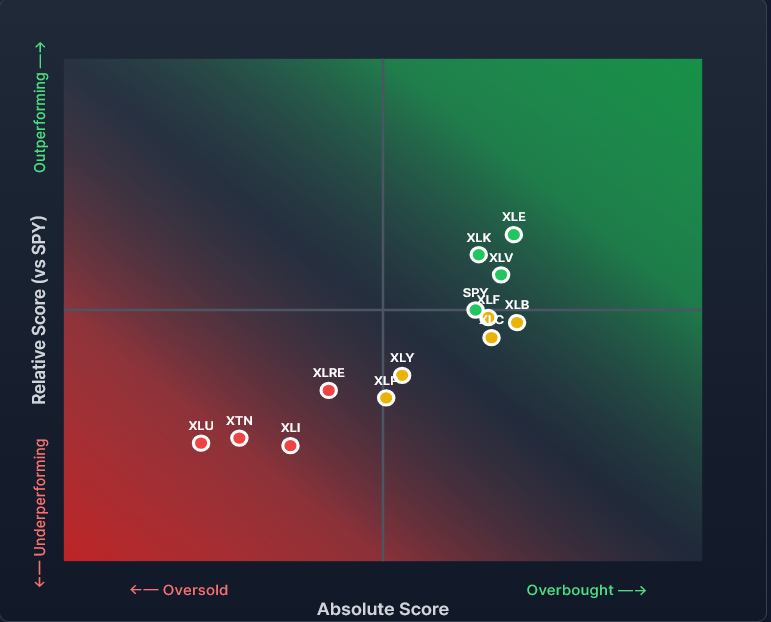
As shown in the second graphic, the sector map shows a little more divergence in scores. Energy, Technology, and Healthcare are leading the market. This points to higher oil prices and a renewed focus on growth and higher beta stocks. Recent news from Merck and Moderna on customized cancer treatments pushed the entire healthcare sector higher. Transportation stocks, utilities, real estate, and industrials are weaker. General weakness in real estate and utilities is likely due to higher yields. However, weakness in industrials and transportation stocks signals concerns about rising economic pressures.
Loss: Why Crashes, Timing and Valuations Matter- Part 3 of 5
The first two articles in this series were about behavior. How to think like an investor instead of a speculator, and how to keep your own wiring and your own training from robbing you. This one is about arithmetic. Cold, unemotional, undefeated arithmetic. Underneath every good decision and every bad one sits a layer of math that does not care how you feel, and Wall Street would very much prefer you never do it in your head.
There are three numbers that decide most of your investing life. What a loss actually costs you to recover. What the price you pay today does to your future returns. And what happens when a bad stretch arrives at the wrong moment in your life? Let’s do the math Wall Street skips, one number at a time.
The Math Of Loss
At some point, you have probably seen a version of the reassuring chart below of a century of market history in which bull markets tower over bear markets, crashes look like tiny notches on a soaring line, and the caption tells you to relax and stay fully invested because it all works out. It is undoubtedly one of the most popular charts in finance, and it sells an illusion of safety.
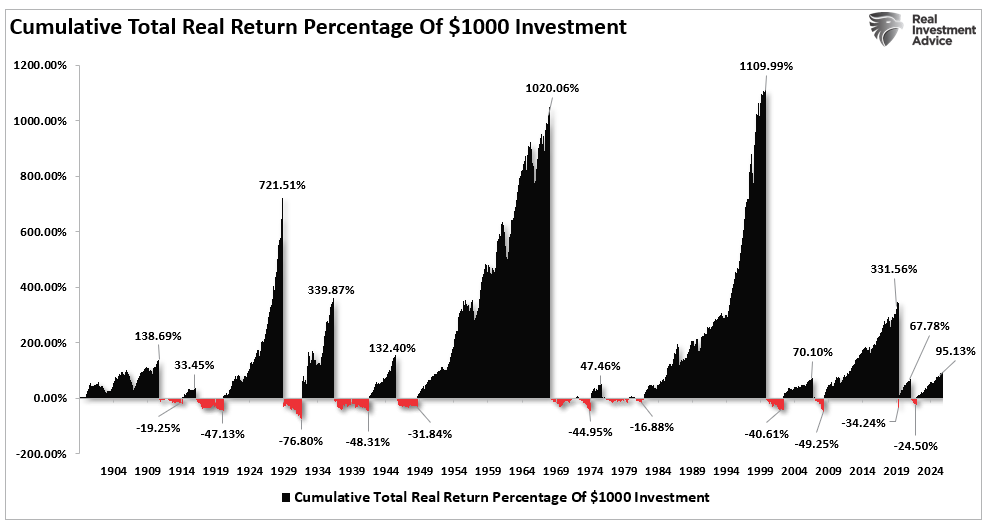
Before you believe the sales pitch that goes along with it, you should ask yourself two simple questions. If staying fully invested through everything is so obviously correct, why does no legendary investor actually do it?

Tweet of the Day
New UPDATED Trading Rules With Desktop Printout
“Want to achieve better long-term success in managing your portfolio? Here are our 15-trading rules for managing market risks.”
Please subscribe to the daily commentary to receive these updates every morning before the opening bell.
If you found this blog useful, please send it to someone else, share it on social media, or contact us to set up a meeting.