


Last Thursday’s Treasury buyback operation was deemed “weak” in the financial media as it bought back just $5.19 billion, less than the $6 billion investors had anticipated. A buyback succeeds only if current bondholders are willing to sell their existing holdings back to the Treasury at the offered price. Thus, a “weak” or undersized buyback operation means they weren’t. Dealers and real-money investors chose to keep their bonds rather than part with them. The weak demand for the buyback was a hidden signal of demand, confirmed by the Treasury auctions.
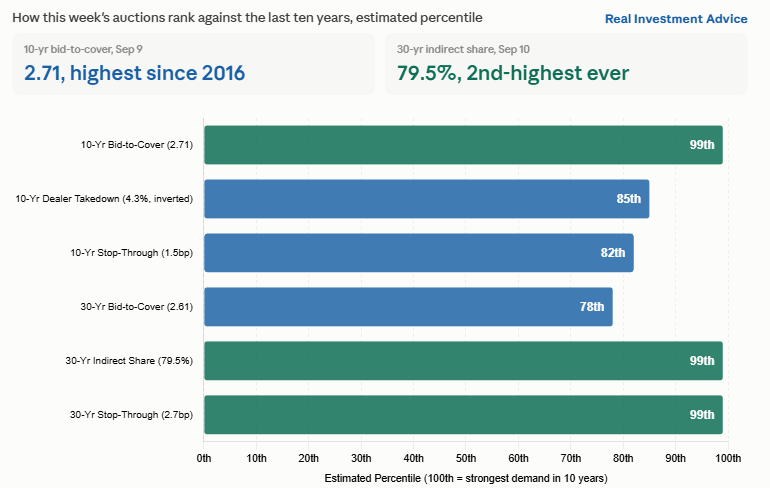
Last Wednesday’s 10-year auction posted a bid-to-cover ratio of 2.71, the highest since April 2016. This measure of demand was off the charts. Moreover, primary Wall Street dealers, the buyers of last resort when demand is weak, absorbed just 4.3% of the offering. When dealers get stuck with a small allocation, it signals strong investor demand.
The next day’s 30-year auction was even more extreme by some measures. Indirect bidders, largely foreign central banks and large institutions, took 79.5% of the offering, the second-highest share on record. The auction stopped through the when-issued yield by 2.7 basis points, also the second-highest stop-through on record. The bid-to-cover at 2.61 is in the upper 75th percentile of results over the last ten years.
The weak buyback and strong auction show that real-money investors are buying Treasuries at these higher yields, even as fast-money traders still sell them.
What To Watch Today
Earnings
- No notable earnings reports
Economy
Market Trading Update
I will tell you one thing: you have to give the bulls their credit. This past week was the perfect setup for a sharp sell-off in the market. Corporate buybacks are sidelined, interest rates spiked, and oil surged, pushing inflation higher. If there was ever a case for a pullback, it was this past week. Nonetheless, the correction that we have discussed over the last two weeks stopped right where the first line of support sits. The S&P 500 closed the week at 7,666, down 0.68%. The part that matters happened on Thursday, with the index trading down to 7,595 and closing dead on its 50-day moving average near 7,600. That was our initial downside target, and the market met it up to that point before Friday’s bounce lifted the price back above the line.
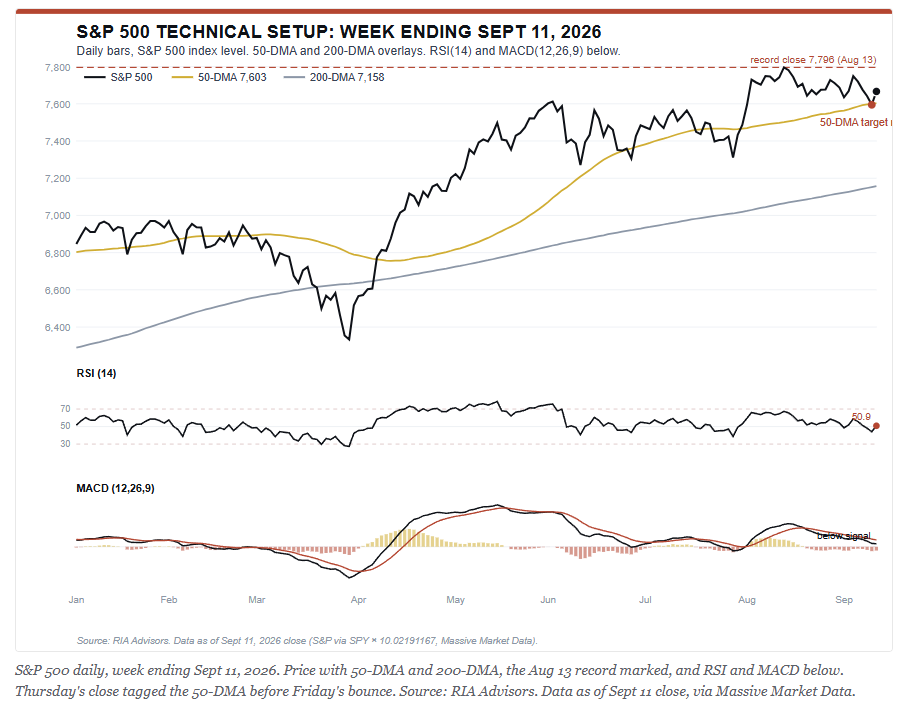
While the 50-DMA held on the first test, overall momentum remains another matter. RSI sits at 50.9, dead neutral, down from the high-50s a week ago. The MACD signal has crossed below its signal line, keeping downward pressure in place into the end of the quarter. Furthermore, the histogram has turned negative, adding to our caution. While the market held support, it did so with weakening momentum, which is the definition of an undecided tape.
From our vantage point, the breadth story is the bigger worry. The equal-weight S&P fell almost three times as hard as the cap-weighted index this past week. Most notably, it was small caps that led the whole thing lower, with volume telling the same story. Of course, the spike in crude oil didn’t help and forced the heaviest selling in the rate-sensitive names, rather than the index leaders. As noted, breadth is the key to a sustainable bull market rally. The current breadth is a warning, but not yet a sell signal.
This coming week keeps our focus on risk management. From that standpoint, we continue to recommend trimming the most extended winners back toward model weight into any push toward the old highs, rather than chasing them. The 50-DMA near 7,600 is the support line that decides our next moves. If we hold it, and the uptrend off the spring lows stays intact, we can keep exposures near normal levels. However, if we lose that support on a closing basis, the next real floor sits much lower at the 200-DMA near 7,158. We suggest keeping some dry powder heading into the Fed rate decision and next Friday’s option expiration.
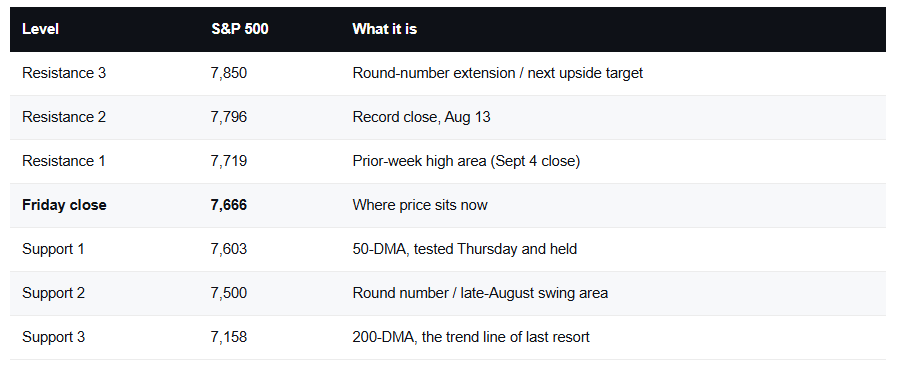
Heading into the end of the month and the quarter, there is one level that dictates portfolio strategy into October. A weekly close back above 7,796, the August record, says the buyers have reclaimed control. A close below 7,600 signals that the 50-DMA has failed and that the market wants deeper support. Everything in between is noise. And next week brings two catalysts big enough to force the break. Trade the level, not the narrative.

CPI & The Week Ahead
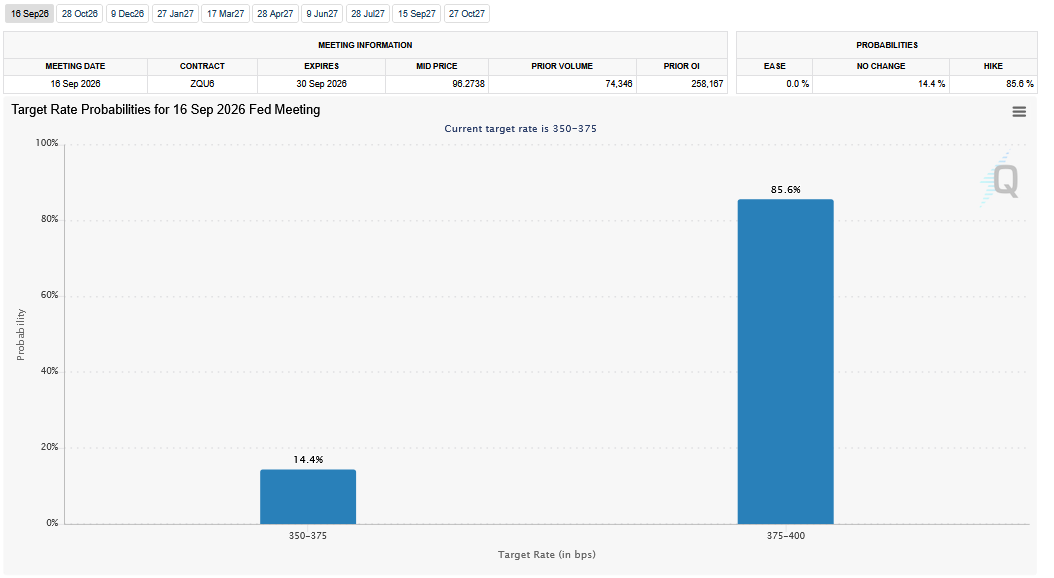
Headline CPI rose 0.4% in August, matching expectations, with the annual rate at 3.4%. Core CPI, however, ran slightly hotter than forecast at 0.3% versus the 0.2% consensus, though the annual core rate held steady at 2.4%. Energy prices drove the headline number: gasoline jumped 3.9%, and the broader energy index rose 2.1%, up 16.3% year over year. Following the data release, September hike odds rose to 85%, as shown below, courtesy of CME’s FedWatch. The market believes the inflation data did not help the case for the doves on the FOMC who would like to hold rates steady.
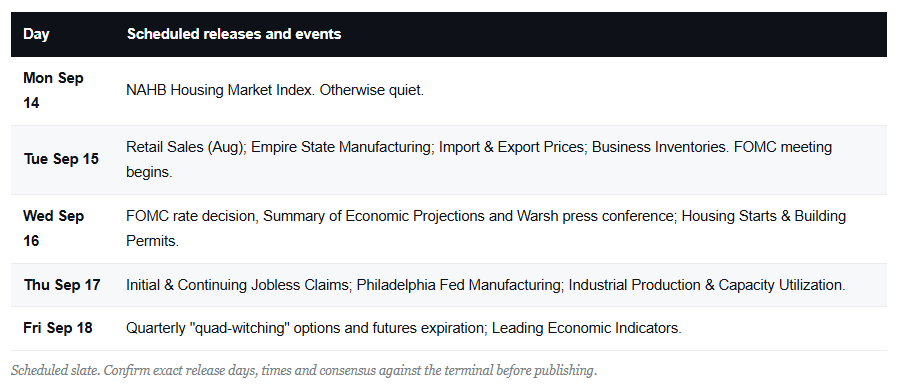
With CPI and PPI out of the way, the market’s attention will focus on Wednesday’s FOMC meeting. In addition to the Fed’s rate decision, the following factors will help form the market reaction.
- The number of dissenters.
- How did Warsh vote?
- The updated Summary of Economic Projections (SEP – dot plots).
- Warsh’s tone at the press conference.
- Any comments on the recent spike in yields and its economic impact.
Also on Wednesday will be the retail sales report. Following last month’s 0.6% decline, the current expectation is for a 0.3% increase.
US Debt Trap: A Crisis Without A Calendar
Every few months, a new essay declares that the US debt trap has finally sprung. The latest one making the rounds from The Economist is well written and genuinely unsettling. It argues that Washington has borrowed so recklessly that the Federal Reserve no longer dares to raise interest rates. Doing so, the piece warns, would detonate the whole structure and send financing costs spiraling out of control. It’s a compelling story, great for clicks and views, and I’ve been reading versions of it since the 2011 credit downgrade.
Here’s the problem with the “US Debt Trap” argument, or any of the myriad variations on the theme: it never comes with a date. Why is that important? Any piece of analysis must include three critical aspects to provide value.
- A specific date when the “crisis” will occur. Without a specific date, the analysis can not be judged for accuracy or validity.
- What will the crisis be specifically? A debt default, financial contagion, market crash, economic recession, etc.
- Most crucially, what will be the end result of the crisis and, specifically, when will it be over?
Without those aspects, and most importantly, without a date the event will occur, the analysis isn’t a “forecast,” it’s a “mood.”
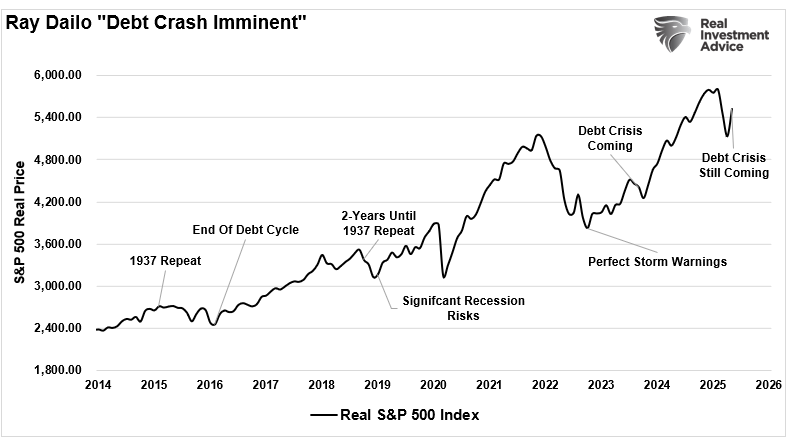
A good example is Ray Dalio, who almost annually predicts that a financial crisis is approaching.
- March 2015 – Hedge Funder Dalio Thinks the Fed Can Repeat 1937 All Over Again
- January 2016 – The 75-Year Debt Supercycle Is Coming To An End
- September 2018 – Ray Dalio Says The Economy Looks Like 1937, And A Downturn Is Coming In About Two Years
- January 2019 – Ray Dalio Sees Significant Risk Of A US Recession
- October 2022 – Dalio Warns Of Perfect Storm For The Economy (That was also the stock market low.)
- September 2023 – Dalio Says The US Is Going To Have A Debt Crisis
But you can even go further back than these when he wrote about some of his biggest mistakes about a decade ago:
“The biggest of these mistakes occurred in 1981-’82, when I became convinced that the U.S. economy was about to fall into a depression. My research had led me to believe that, with the Federal Reserve’s tight money policy and lots of debt outstanding, there would be a global wave of debt defaults, and if the Fed tried to handle it by printing money, inflation would accelerate. I was so certain that a depression was coming that I proclaimed it in newspaper columns, on TV, even in testimony to Congress.“
Even though Dalio understands his mistakes from 1981 to 1982, he has been repeating them over the last decade. I am certainly not picking on Ray Dalio; he is a brilliant person with a wildly successful track record of managing money.
“However, investors who listened to Dalio’s predictions of a coming “depression” a decade ago missed out on one of the most significant bull markets in U.S. history.”

Tweet of the Day
New UPDATED Trading Rules With Desktop Printout
“Want to achieve better long-term success in managing your portfolio? Here are our 15-trading rules for managing market risks.”
Please subscribe to the daily commentary to receive these updates every morning before the opening bell.
If you found this blog useful, please send it to someone else, share it on social media, or contact us to set up a meeting.