


Friday’s weak retail sales report did more damage to the hawkish case. Sales fell 0.6% in July against expectations for a 0.1% gain. The control group, the piece that feeds directly into GDP, dropped 0.4%. That was its first decline this year. The print landed a week after payrolls fell 23,000 and two days after PPI came in flat.
The bulls will point to Prime Day. Amazon moved the event to June this year, so nonstore sales fell 2.2% in July after a 7.7% June surge. Hot weather and the end of the World Cup pulled traffic too. Strip out the calendar quirk, and spending was probably close to flat.
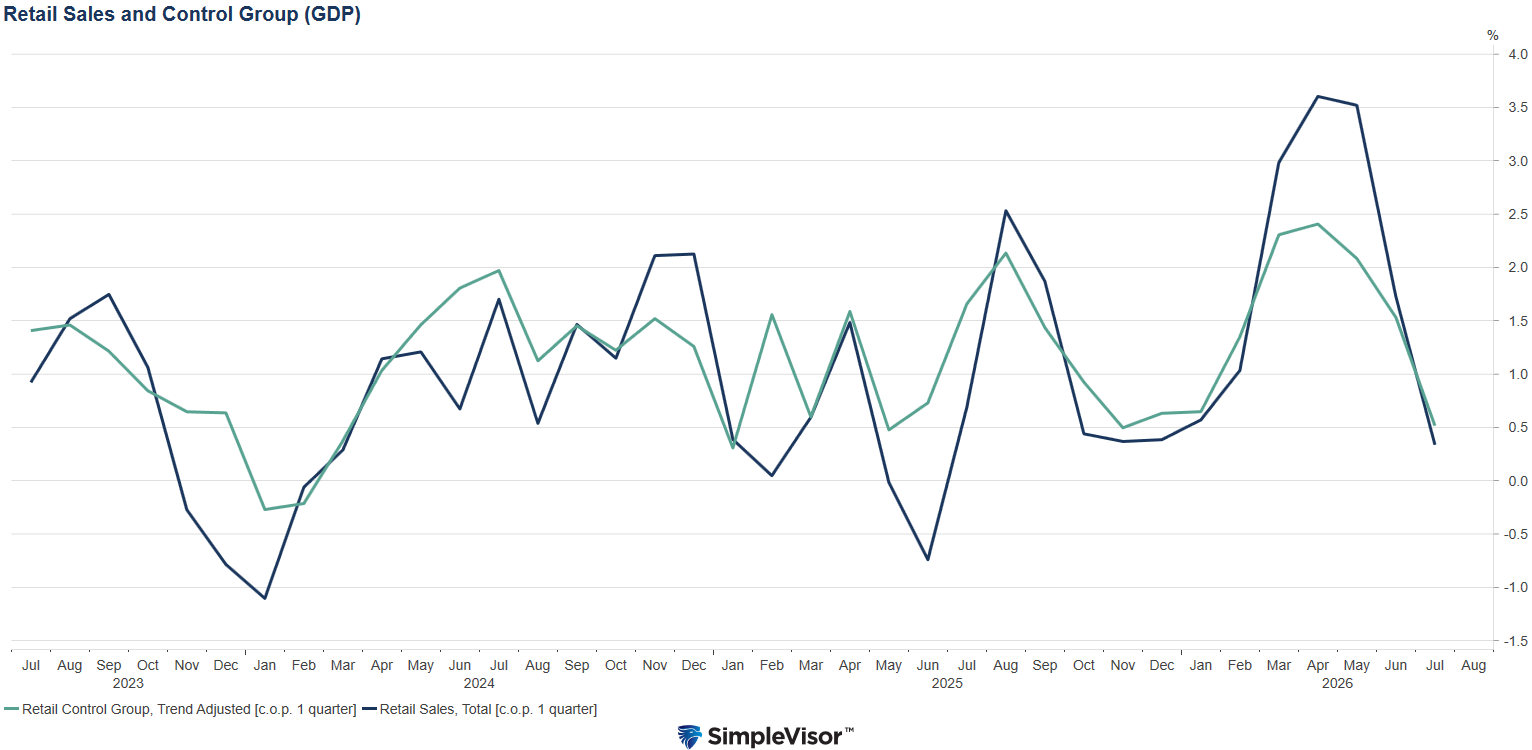
But the weak retail sales headline is not where the real signal is. As we show below, on a rolling quarterly basis, both total sales and the control group have given back the entire spring acceleration. Total momentum peaked near 3.6% in April and now sits near 0.35%. The control group peaked at 2.4% and has fallen to roughly 0.5%. One month can be explained away. A four-month round trip cannot.
That matters for a Fed with three members who dissented in July because they wanted to hike. Their case rested on an economy running hot enough for firms to keep pushing prices through. Weak retail sales undercut that logic directly. Consumers who stop showing up do not validate price increases. Headline inflation is still 3.3%, but prices fell in June and were flat in July. The hawks are running out of evidence.
The bond market agreed. The curve steepened Friday after Thursday’s sloppy 30-year auction, yet yields finished the week lower. The front end is pricing in a lower risk of a hike, while the long end still worries about supply.
What To Watch Today
Earnings
Economy
Market Trading Update
day line it has not closed beneath since April. That is a healthy, intact uptrend, and it deserves respect. The problem is not direction. It is the distance from the longer-term trend.
At Friday’s close, the index sat roughly 10% above its 200-day moving average. That is one of the widest gaps of this entire cycle, and it sits about 3.7% above the 50-day line, too. Add our Money Flow and Breadth Indicator at 75%, with 72% of members above their own 200-day average. This market has done a lot of work in a short window. Friday’s quiet fade from record highs is the kind of small caution flag that shows up when a tape gets this extended.
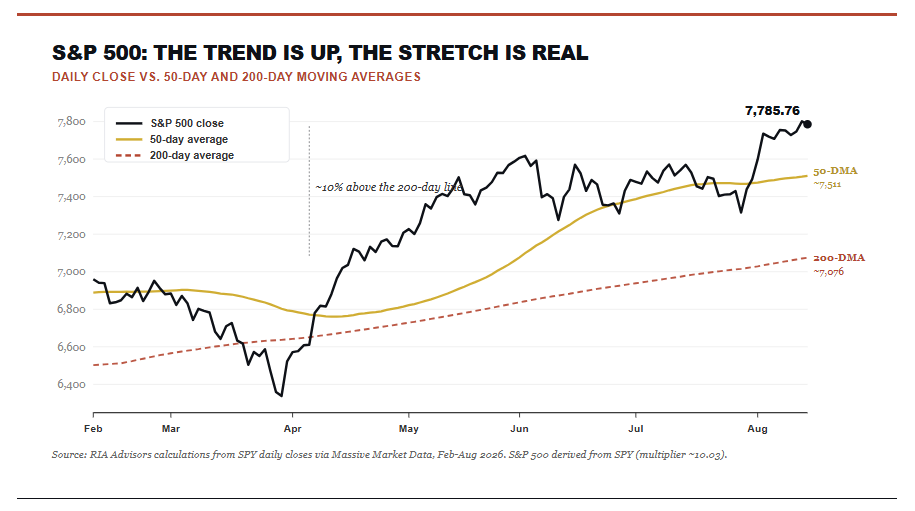
Look at the ceiling first. Price is pressed right against its own record highs, with Thursday’s 7,801 close and 7,817 intraday high just overhead. Above that sits the round 8,000 mark, which also happens to be Goldman’s year-end target. Round numbers act like magnets until they act like ceilings, so that’s where sellers tend to dig in. The floor sits much further away. First support is the 20-day line near 7,585, then the 50-day line near 7,510, both comfortably below Friday’s close. The takeaway is the asymmetry. There’s little cushion above, and plenty of open air below, down to those averages.
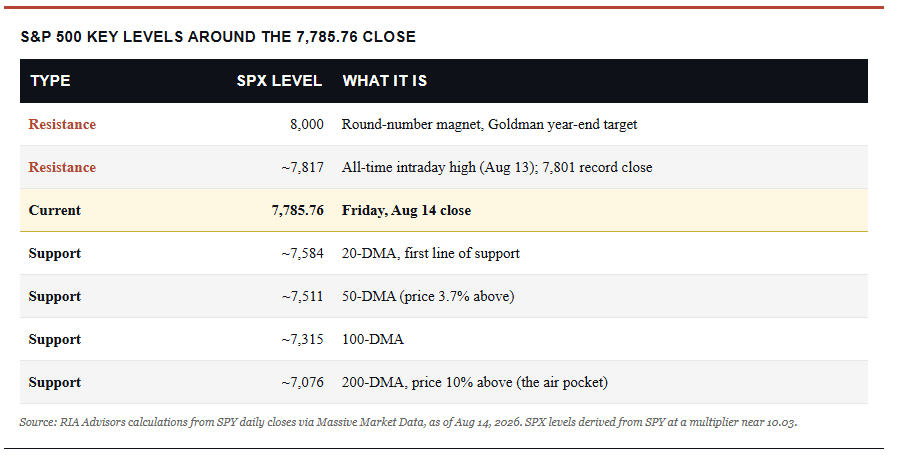
Neither support level is very far away, and a pullback to either would be routine housekeeping within an uptrend, not a break of it. The number that matters for risk is lower down. That gap from here to the rising 200-day line near 7,076 is roughly 10%, and that mean-reversion “air pocket” is the risk. The trend remains up, but momentum is overbought; therefore, entries here offer poor near-term reward relative to risk.

The Week Ahead
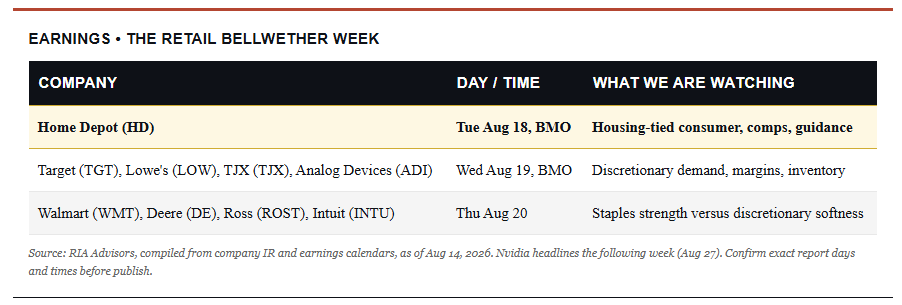
The earnings calendar shifts from technology to the consumer this week. Home Depot reports Tuesday, followed by Target, Lowe’s, and TJX on Wednesday, and Walmart on Thursday. That lineup arrives days after retail sales fell 0.6% in July, the weakest reading in more than a year. Guidance will matter more than the quarter itself. If Walmart and Target flag trade-down behavior or thinner back-to-school baskets, the consumer story gets much harder to dismiss as a one-month blip.
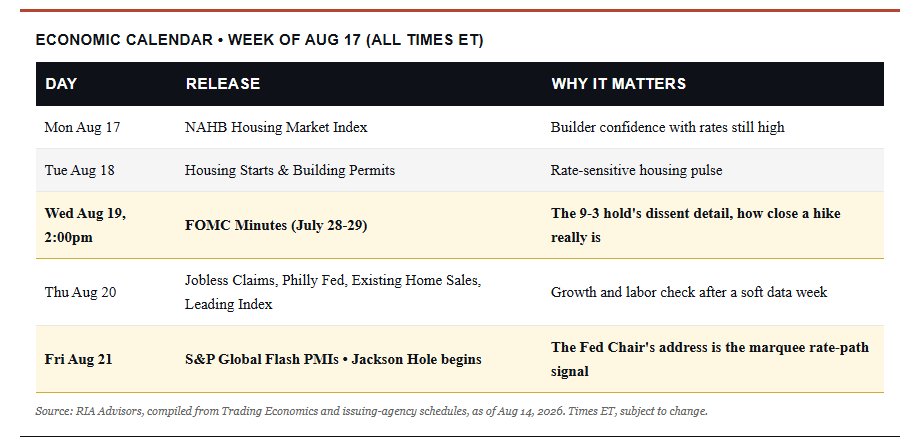
The FOMC minutes on Wednesday afternoon are the main event on the economic calendar. Three members voted to hike in July, and the minutes should show how close the rest of the Committee sat to joining them. Keep in mind that the meeting predates last week’s inflation data. CPI rose only 0.1% and PPI came in flat, so a hawkish tone in the minutes may already be stale. Traders will still hunt for the conditions the dissenters laid out, because those are the tests September’s decision turns on.
The rest of the calendar leans toward housing and manufacturing. Empire State manufacturing and NAHB builder sentiment open the week Monday. Housing starts, building permits, and industrial production follow on Tuesday. Builder confidence sits at 34, deep in contraction territory, and mortgage rates near 6.8% keep doing damage. Thursday brings jobless claims and the Philadelphia Fed survey, which spiked to 41.4 last month and should give most of that back. Flash PMIs close the week on Friday.
Yen Intervention Narrative: What’s True and Not
Here is a narrative that needs the most attention. The “doomers” claim that the Treasury Secretary, Scott Bessent, is quietly opening “swap lines” to stop Japan from dumping its Treasuries in a “fire sale” that sends U.S. yields screaming higher.
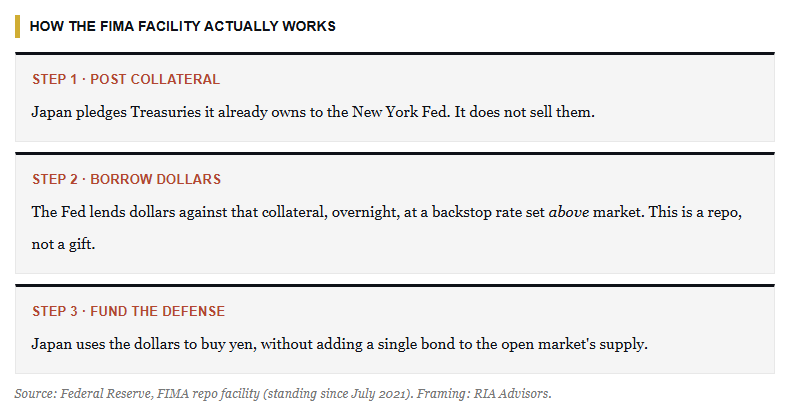
The motive is real, and with the 10-year yield near 4.6%, no one at the Treasury wants the largest foreign holder of American debt selling into a soft market. But that is also the Treasury’s job as the governor of the world’s reserve currency. Both the Federal Reserve and the Treasury provide liquidity when needed to maintain financial stability. Currently, the tool Bessent is using is an expanded FIMA facility that targets that fear directly. However, these are not “swap lines,” and the difference is important to understand.

Tweet of the Day
New UPDATED Trading Rules With Desktop Printout
“Want to achieve better long-term success in managing your portfolio? Here are our 15-trading rules for managing market risks.”
Please subscribe to the daily commentary to receive these updates every morning before the opening bell.
If you found this blog useful, please send it to someone else, share it on social media, or contact us to set up a meeting.