


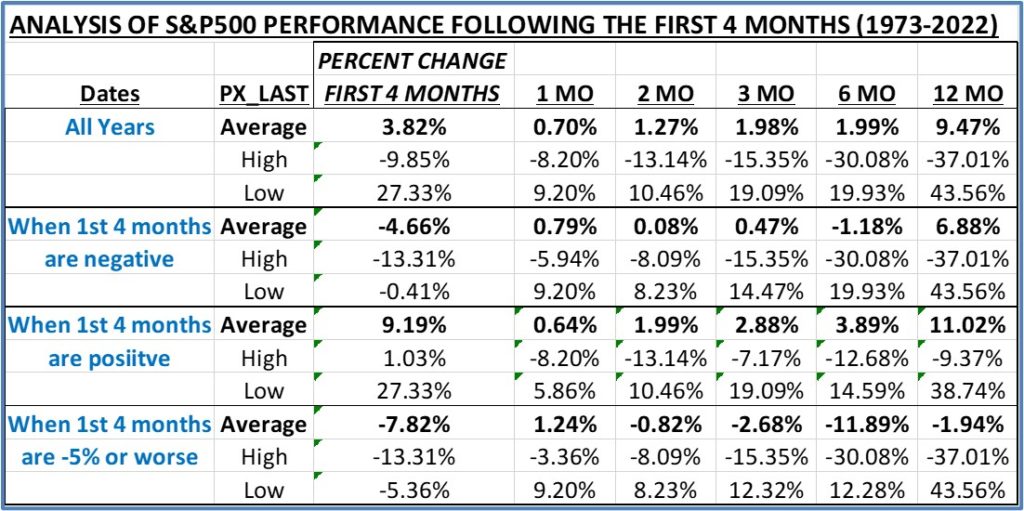
The S&P500 fell 13.31% in the first 4 months of 2022. That is the largest drop for the first 4 months of a year in the past 50 years. The table below shows 8 years in which the S&P500 fell 5% or more January 1 to April 30. The table also shows the performance that followed these years of bad early month performance. The diagnosis is not great for the market following this early poor performance:
- The average 1, 2, 3, 6, and 12-month performance for all years following the first 4 months is 0.70%, 1.27%, 1.98%, 1.99%, and 9.47%, respectively.
- The average 1, 2, 3, 6, and 12-month performance following the first 4 months for negative years is worse: 0.79%, 0.08%, 0.47%, -1.18%, and 6.88%, respectively. Each period’s performance is worse when the first 4-month performance is less than 0%.
- When the first 4 months have declined 5% or more, the average 1, 2, 3, 6, and 12-month performance is even worse (except for the 1-month bounce back): 1.24%, -0.82%, -2.68%, -11.89%, and -1.94%, respectively.
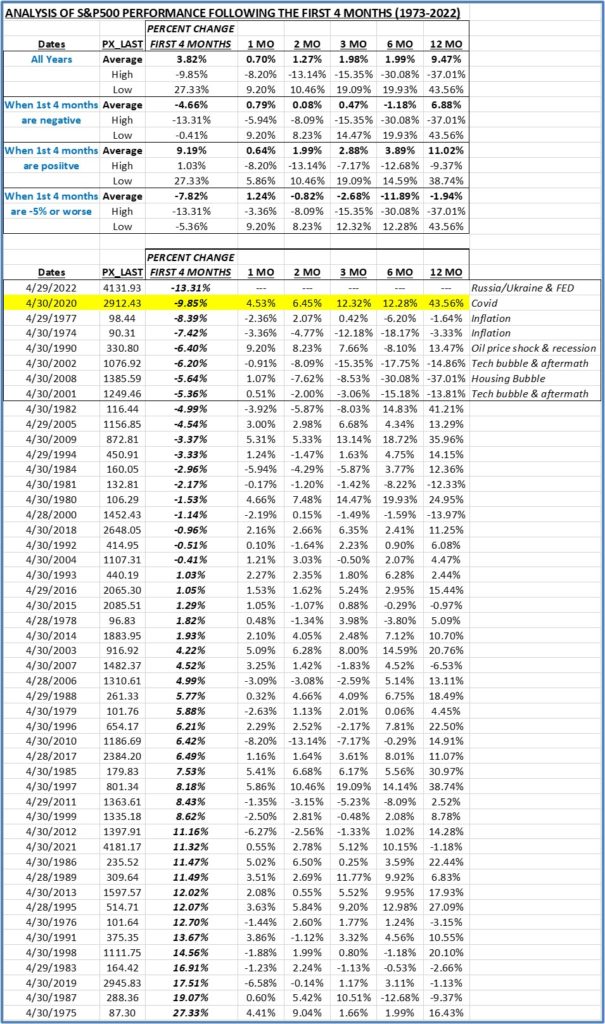
(The table at the bottom of this report details the performance for all years from 1973 to 2022.)
So, is it time to throw in the towel and step to the sidelines? Maybe, but on closer examination maybe not. TPA is not an economist, but the table at the bottom of the report shows brief reasons for the worst first 4-month performance. 2001 and 2002 were declines based on the aftermath of the bursting TECH bubble. The drop in 2008 was due to the Financial recession caused by the housing bubble brought on by mortgage back excesses and weak lending standards. TPA would argue that neither of these conditions exists today.
The conditions in 1974, 1977, and 1990 may be closer parallels today as they concerned inflation and oil shocks and subsequent FED actions. TPA would argue that the ultimate question is whether the current situation is really the result of general economic conditions or the exogenous events of Russia/Ukraine and Covid. Is inflation the result of an overheated economy out of control or shortages and logistical issues caused by the lingering problems of Covid and Russia’s invasion of Ukraine? It is a worthwhile question to ask since the performance after the first shocks of Covid was better than the overall average for all 50 years: 1-month 4.53%, 2-month 6.45%, 3-month 12.32%, 6-month 12.28%, and 12-month 43.56%.
One thing to think about when you are ruminating over these results. In a very unscientific TPA survey of 22 traders and managers, when asked the question, “What would the market do if the Russia-Ukraine war ended tomorrow?”, 100% of the answers indicated the market would rocket higher. How would you answer that question?


Jeff Marcus founded Turning Point Analytics (TPA) in 2009 after 25 years on trading desks and 13 years as a head trader to provide strategic and technical research to institutional clients. Turning Point Analytics (TPA) provides a unique strategy that works as an overlay to clients’ good fundamental analysis. After 10 years of serving only large institutions, TPA now offers its research services to mid and small managers, RIA’s, and wealthy sophisticated individuals looking for a way to increase their returns and outperform their peers.
Subscribe 2 Week Trial
Customer Relationship Summary (Form CRS)