


Why does TPA’s Relative Rotation Fund perform so well?
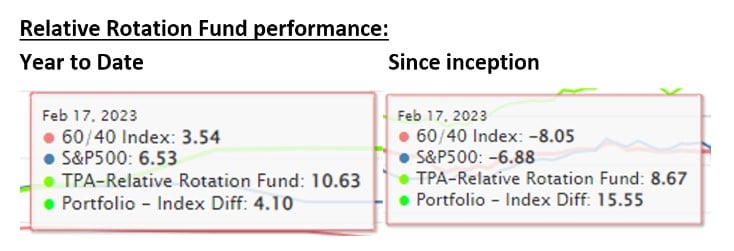
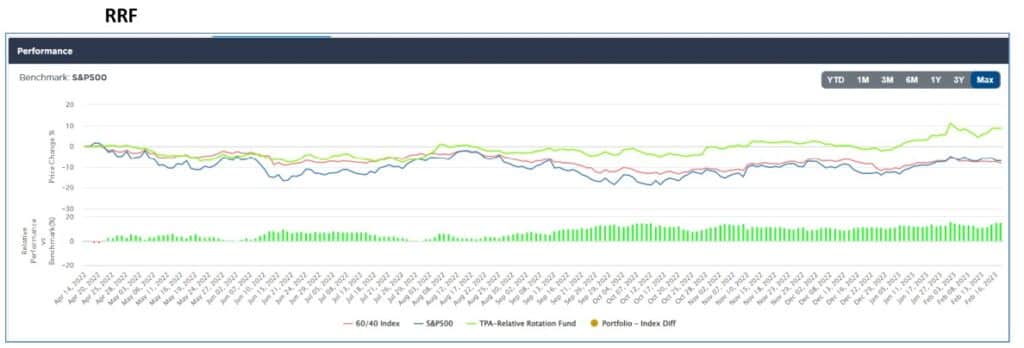
The Relative Rotation Fund (RRF) is up 10.63% YTD, while the S&P500 is up 6.53% YTD. Since inception on 4/22/22, the RRF is beating the benchmark by 15.55%; the RRF is up 8.67%, while the S&P500 is down -6.88% (see tables and chart below). Yes, RRF has a short component, which helps it during down markets, but if you notice the YTD performance and look closely at the chart below, you will see that RRF has outperformed the benchmark in up and down markets.
YTD and since inception, the RRF has also beaten a 60/40 portfolio by 7.09% and 16.72%, respectively.

Why does RRF outperform? 4 reasons:
- The stocks in RRF have been out of favor so their prices have moved down to a point where they can show real future value.
- RRF strategy incorporates the sector rotation, so it also captures the broader sector moving into favor.
- RRF’s algorithm does not wait until the stock has run too far, but captures it as it is just starting to come into favor.
- TPA uses a technical filter to ensure that stocks in the RRF are not overbought or oversold and are not giving false signal.
Learn about and register for TPA-TTG here: https://simplevisor.com/tpaAnalytics
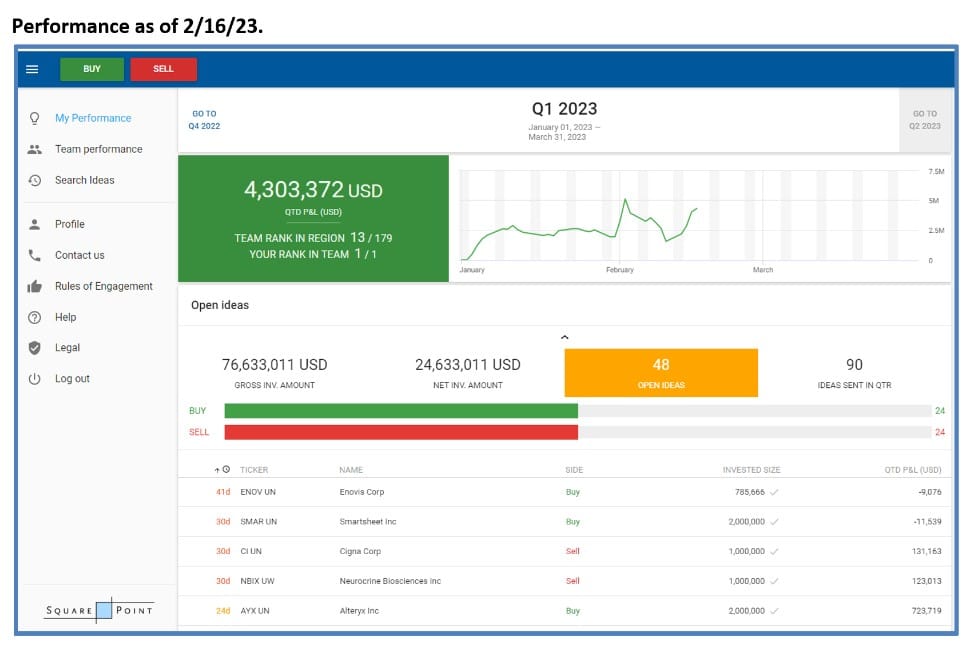
We have also incorporated the RRF strategy for the alpha capture firm Square Point. The Square Point trades are executed during the market on Monday morning each week. So far, this quarter RRF ranks 13 out of 179 institutional traders or the top 7%. RRF has not only proven itself versus the benchmark S&P500, but also versus a large group of investment professionals.

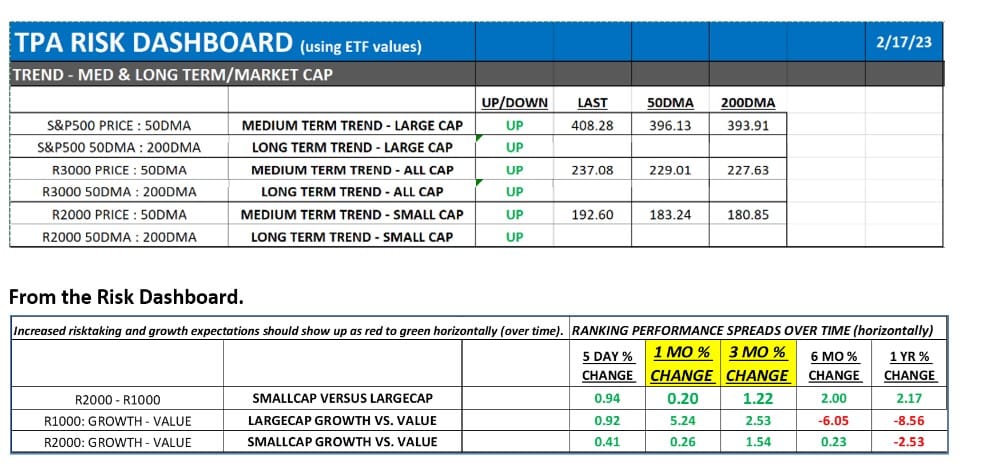
S&P500, Russell 1000, and Russell 2000 are all technically bullish
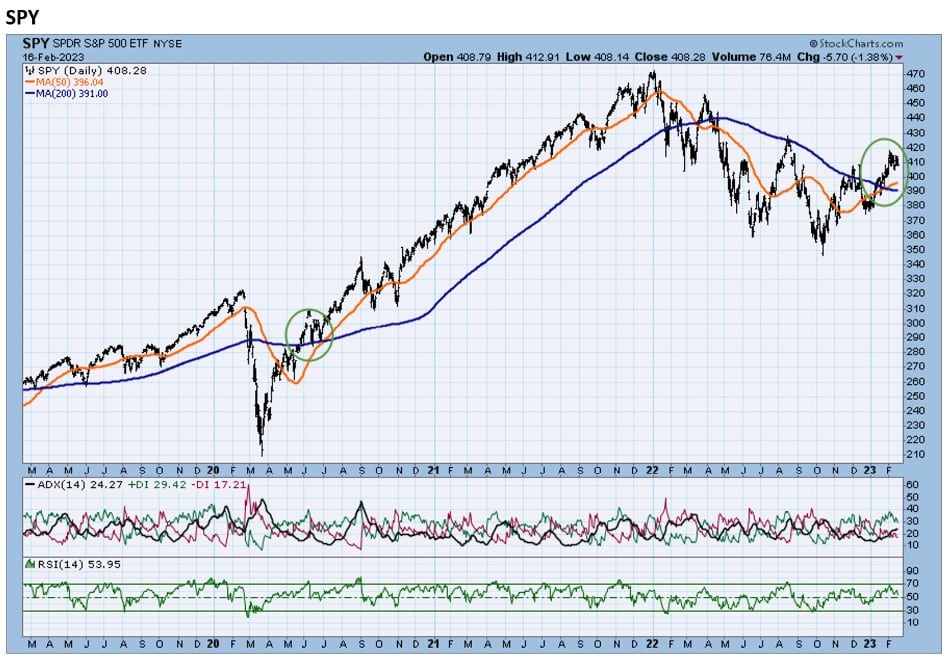
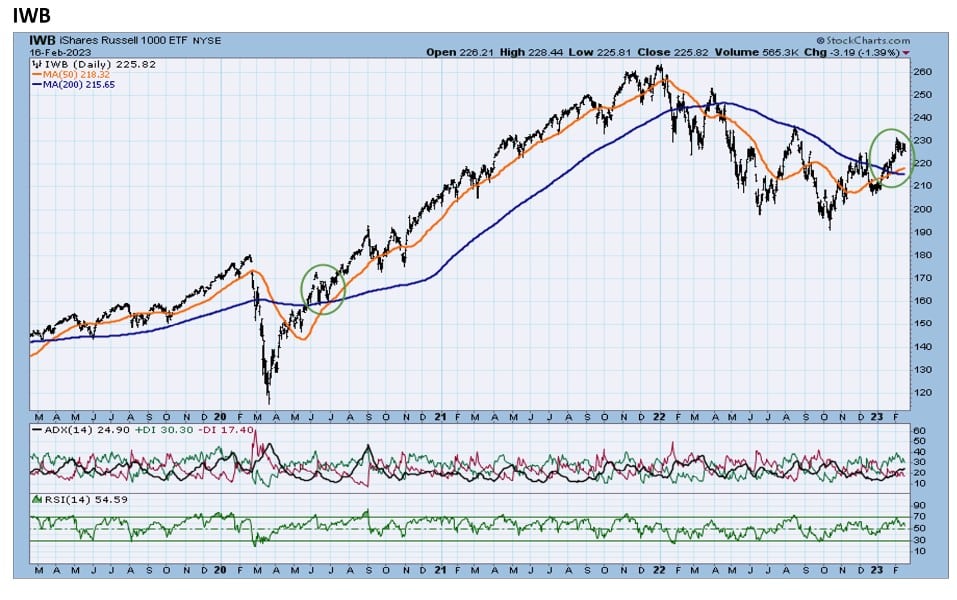
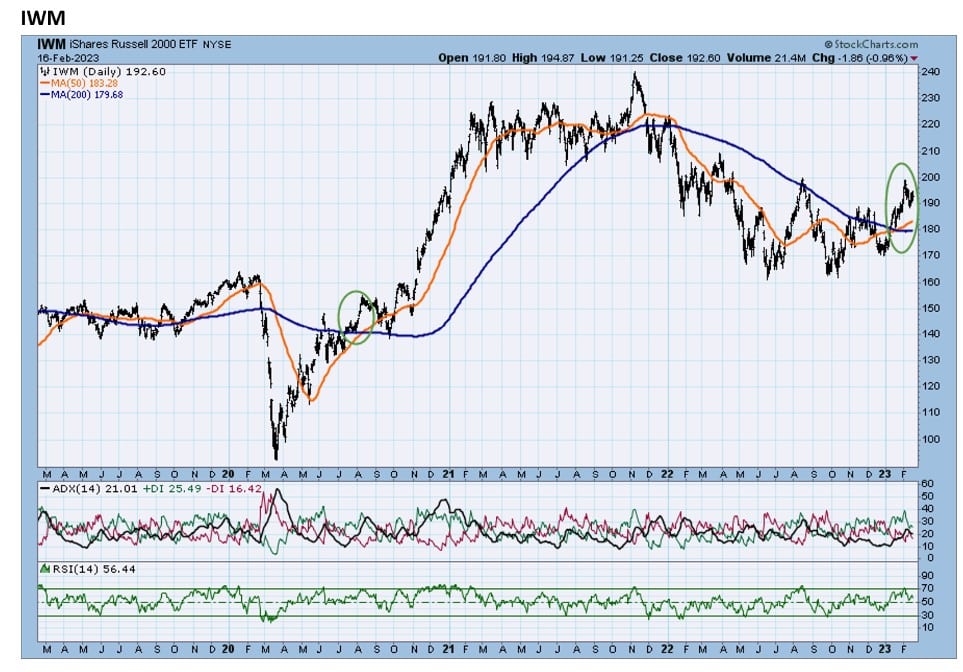
The benchmark S&P500, large cap Russell 1000, and the small cap Russell 2000 are all long-term and intermediate-term bullish as defined by:
- 50DMA above the 200DMA – long-term
- Price above 50DMA – intermediate-term
Please see the relevant section of the TPA Risk Dashboard below.
The last time these 3 occurred in concert was August 2020 or almost 3 years ago. After all 3 indexes traded 50DMA above 200DMA and Price above 50DMA, the S&P500 rallied over 35% in the next 14 months (see all 3 charts below).
In addition, a look at the risk-on measures of the market shows that investors have been willing to put on risk over the past 3 months. The table below from the Risk Dashboard shows that, over the past 3 months, Small Cap is outperforming Large Cap, Large Cap Growth is outperforming Large Cap Value, and Small Cap Growth is outperforming Small Cap Value.


Jeff Marcus founded Turning Point Analytics (TPA) in 2009 after 25 years on trading desks and 13 years as a head trader to provide strategic and technical research to institutional clients. Turning Point Analytics (TPA) provides a unique strategy that works as an overlay to clients’ good fundamental analysis. After 10 years of serving only large institutions, TPA now offers its research services to mid and small managers, RIA’s, and wealthy sophisticated individuals looking for a way to increase their returns and outperform their peers.
Subscribe 2 Week Trial
Customer Relationship Summary (Form CRS)