


Kevin Warsh delivers his first Jackson Hole speech as Fed Chair on Friday, August 28, at the Kansas City Fed’s annual symposium in Wyoming. The meeting occurs less than three weeks before the September 16 FOMC decision. While the official topic is financial innovation in payments, Wall Street will primarily want to see whether Warsh tries to talk the hawks out of their tightening bias.
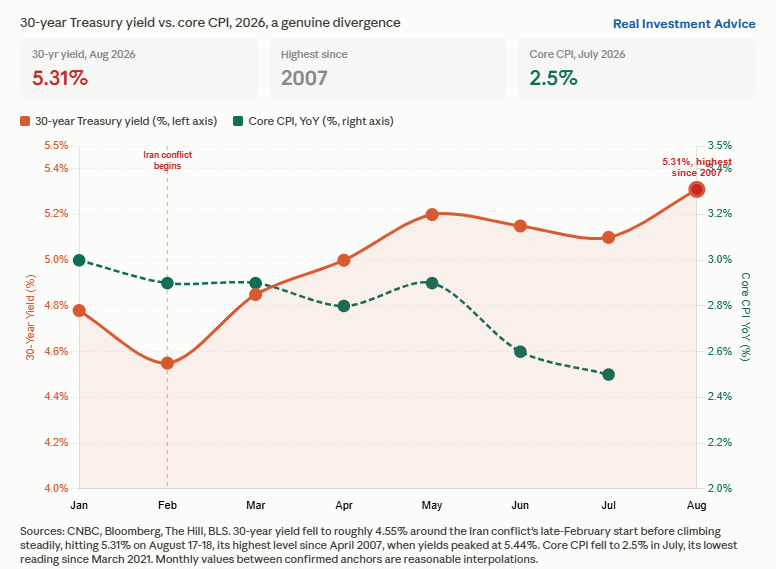
The backdrop Warsh faces is difficult. The 30-year UST yield is at its highest level since 2007. June and July CPI cooled significantly, with core inflation down to 2.5%, the lowest since 2021. Growth is slowing, the labor market just posted a negative payroll print, and Walmart’s signaled consumers are pulling back. Yet several FOMC members continue pushing for a hike, and futures markets oscillate between 35% and 65% odds of a September hike.
If we look at how Warsh has handled public speeches thus far, the expectation may be that he will say as little as possible. He has stopped giving forward guidance at almost every opportunity. Further, he reduced the size of the FOMC statement and has tended to be elusive during his FOMC press conferences.
Recently he said higher bond market yields are doing their job for them. Since then, yields have risen further, CPI weakened, and economic growth slowed. Might Warsh’s speech stick to his free-market principles? Reveal little, keep Fed Funds where they are, and let the bond market do its job?
What To Watch Today
Earnings
Economy
Market Trading Update
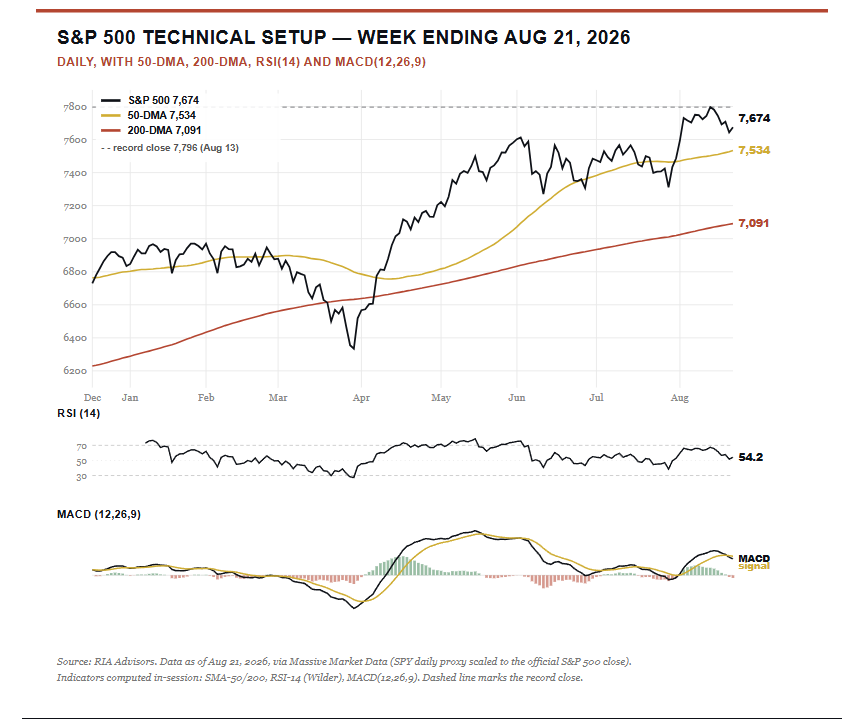
As noted above, while the overall market was only down mildly this past week, the momentum trade remained under pressure. Despite all the seemingly brutal headlines this past week, the S&P 500 is only down ~1.6% from the record close of 7,796 it set on August 13. However, it still sits about 1.9% above a rising 50-day moving average and a comfortable 8.3% above the 200-day, so nothing about the trend structure is technically broken.
Underneath, though, the momentum picture has quietly deteriorated. The MACD rolled over this week and crossed below its signal line, the first bearish crossover since the spring, with the histogram sliding to negative 9 index points. That is the kind of shift that tends to show up before price, not after it.
The 14-day RSI has cooled to 54, squarely neutral and well off the overbought readings that came with the August run to new highs. In plain terms, the buyers are getting tired even though the tape has not cracked. Volatility stayed notably calm through the decline, with the VIX easing on the week rather than spiking, which suggests the selling has been an orderly rotation rather than panic. This is worth noting because the market “calm” tends to last right up until it does not. September tends to be the weakest trading month of the year.
So, as we head into next week, here are the important levels to watch.
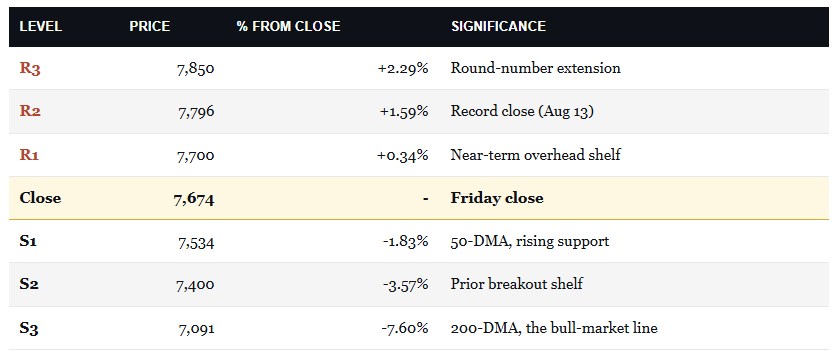
The first resistance level is the 7,700 shelf, then the 7,796 record. Goldman Sachs currently has 8,000 as its year-end target for the market, which doesn’t leave much headroom. On the downside, the 50-DMA near 7,534 is the line that counts. It has held every pullback since April, and a decisive close beneath it would be the first genuine technical warning that the character of this market has changed. Below there, 7,400 is the next shelf, and the 200-DMA at 7,091 is the level that defines the bull market itself. That is a 3-to-1 risk/reward outlook, which should be considered relative to your equity exposure levels.
For positioning, this is a moment for discipline, not heroics. With momentum rolling over into a wall of event risk, we continue to recommend trimming the most extended mega-cap technology winners back toward model weight and letting cash build rather than chasing the tape up here. The place to add is the 50-DMA, not the highs, and a close below 7,534 is the trigger to get more defensive.
The single line to watch is the 50-day at 7,534. Hold it, and this is a routine p

The Week Ahead
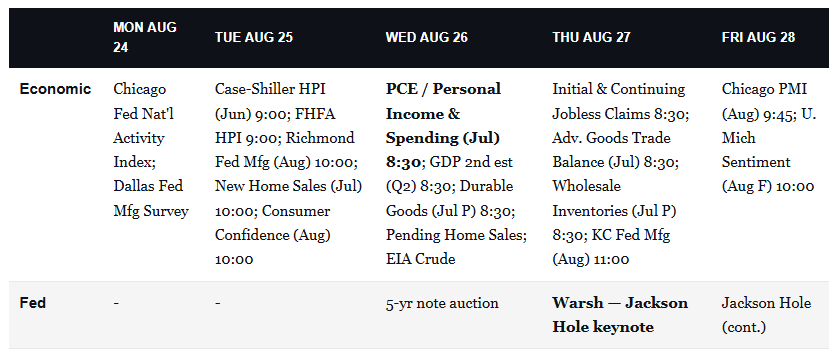
As we led, Warsh’s opening speech at Jackson Hole will be closely watched for clues on whether the Fed hikes in a few weeks. Further, the PCE Price Index on Wednesday will help us gauge their stance. The headline number is expected to rise by 0.2% with core PCE rising by 0.1%. Those estimates would keep inflation benign for a second month in a row, making it easier for those not wanting to hike rates to hold their ground.
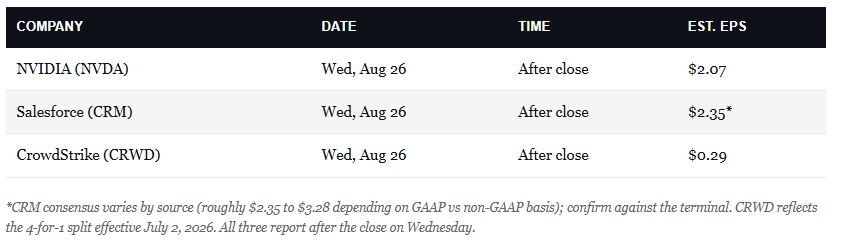
Nvidia reports Q2 fiscal 2027 earnings Wednesday, August 26, after the close. The company guided revenue to approximately $91 billion, plus or minus 2%, marking another large jump from Q1’s $81.6 billion, up 20% from the prior quarter and 85% year over year. Investors will key on forward guidance, data center revenue, and any commentary on the Blackwell ramp. Full-year FY2027 consensus sits at $391.3 billion in revenue and $9.34 in EPS, leaving little room for a guidance disappointment.
Normal Interest Rates: What The Debt Panic Gets Wrong
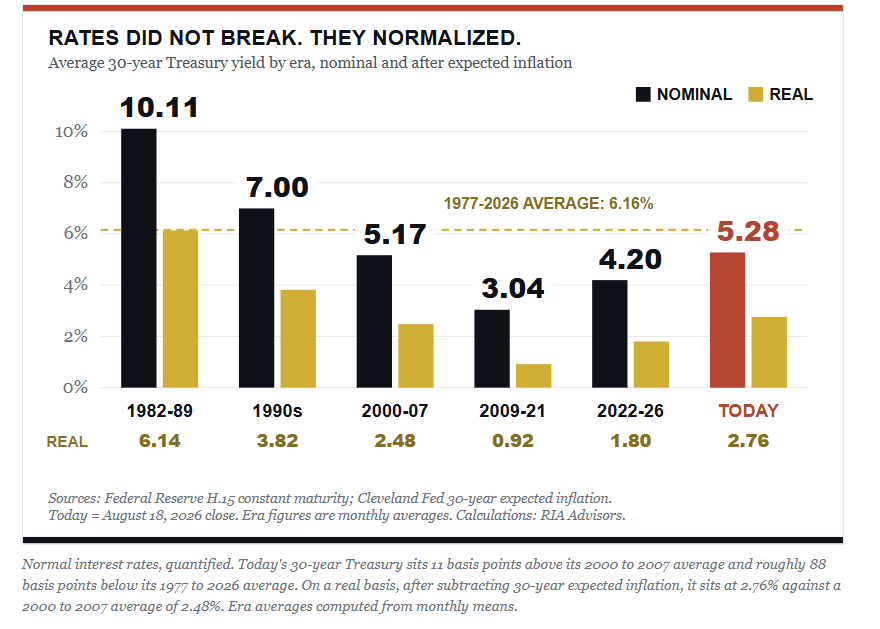
Let’s start with Adam’s analogy, which is vivid and understandable, and why it had traction. Depth equals pressure; pressure equals stress; and somewhere down there, the hull of the ship fails. The symbolism is good; a submarine has a fixed “crush depth” set by the laws of physics. However, an economy doesn’t. What matters isn’t how deep yields go, but whether the borrower’s income is compounding faster than the interest clock is ticking. Moreover, we must know how much of the existing debt has actually repriced.
Here’s the problem with that argument in its popular form. It treats a 5% long bond as the oddity. Yet a 5% long bond is NOT the anomaly. What was odd was the fifteen years of zero-rate policy and four rounds of quantitative easing that taught a whole generation of investors that money was “free.” We’ve written about this before, and the data on rising interest rates has consistently refused to cooperate with the crash thesis.
So the first job is to define what “normal” actually means. If normal interest rates are the 5% kind, then the last decade and a half was the anomaly, and the current tape is a return to form. If free money is the baseline, everything looks like a crisis. One of those framings has 60 years of data behind it.
Rates aren’t the disease. They’re the thermometer.

Tweet of the Day
New UPDATED Trading Rules With Desktop Printout
“Want to achieve better long-term success in managing your portfolio? Here are our 15-trading rules for managing market risks.”
Please subscribe to the daily commentary to receive these updates every morning before the opening bell.
If you found this blog useful, please send it to someone else, share it on social media, or contact us to set up a meeting.