


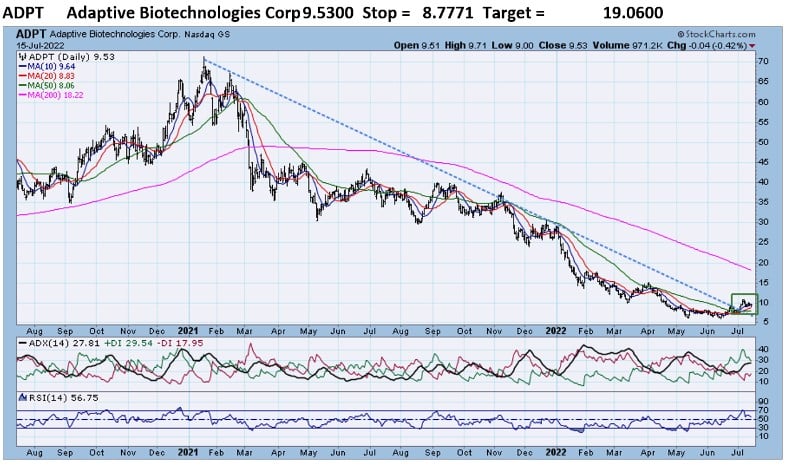
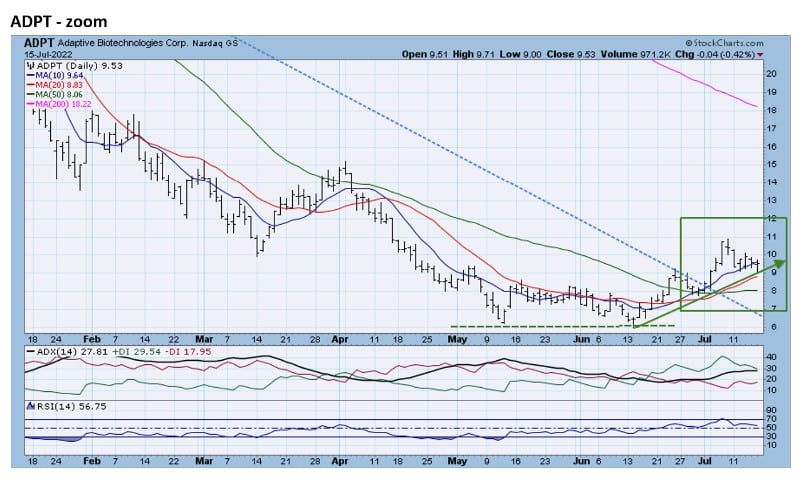
- ADPT has changed trend direction after falling over 90% from its 2021 highs. ADPT rose above its steep, 18-month downtrend in July. The zoom chart reveals a double-bottom in May and June that confirms the lows have been set. A pattern of higher lows and higher highs since early June sets up a move to higher prices.
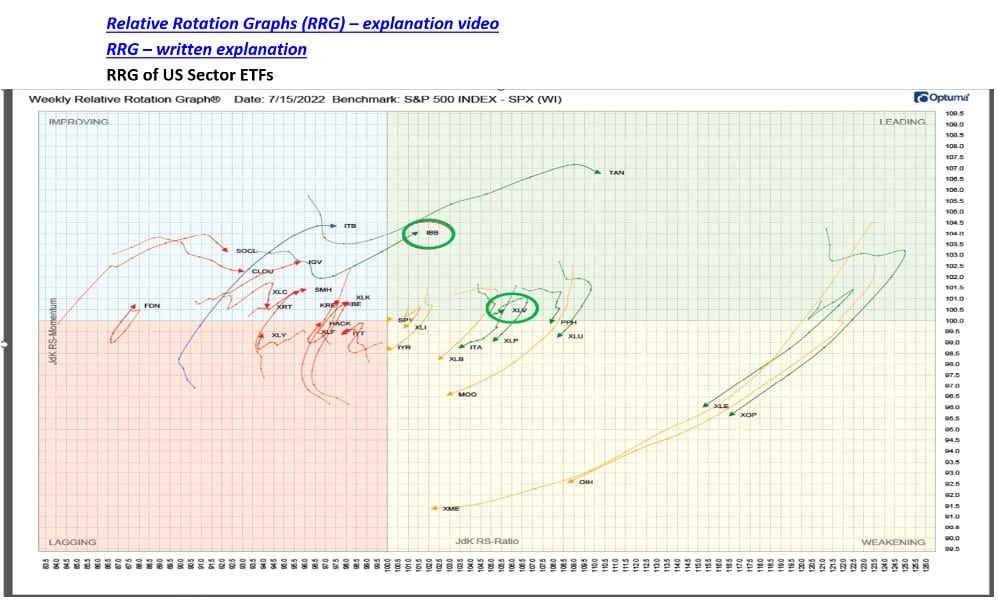
RRG analysis shows that Biotech (IBB) has just entered the Leading quadrant and that Health Care (XLV) has returned to the Leading quadrant after some short-term weakness.
Relative Rotation Graphs (RRG) – explanation video
RRG of US Sector ETFs

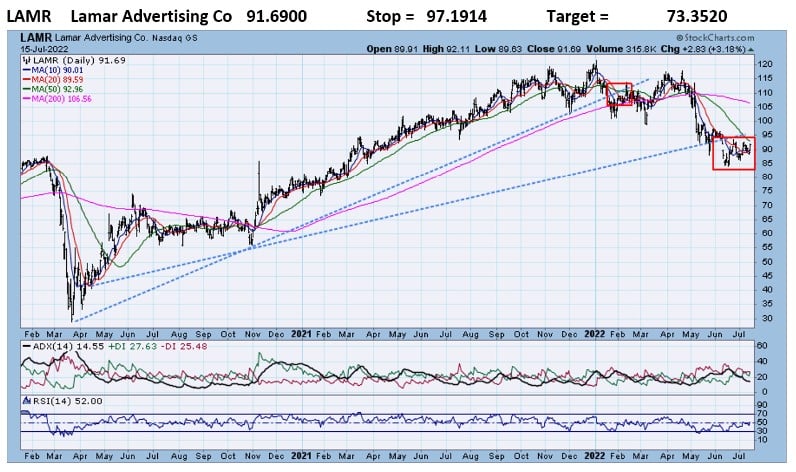
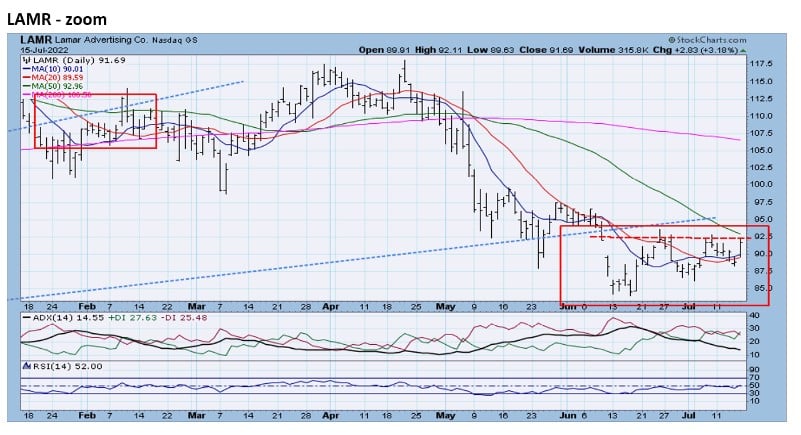
LAMR fell below the 21-month uptrend line in February and the 2-year uptrend line in June. LAMR had rallied 300% from its March 2020 lows to the December 2021 highs, setting up a severe decline if the long-term uptrend is broken. The zoom chart shows that recent rally merely puts LAMR at breakpoint resistance


Jeff Marcus founded Turning Point Analytics (TPA) in 2009 after 25 years on trading desks and 13 years as a head trader to provide strategic and technical research to institutional clients. Turning Point Analytics (TPA) provides a unique strategy that works as an overlay to clients’ good fundamental analysis. After 10 years of serving only large institutions, TPA now offers its research services to mid and small managers, RIA’s, and wealthy sophisticated individuals looking for a way to increase their returns and outperform their peers.
Subscribe 2 Week Trial
Customer Relationship Summary (Form CRS)