


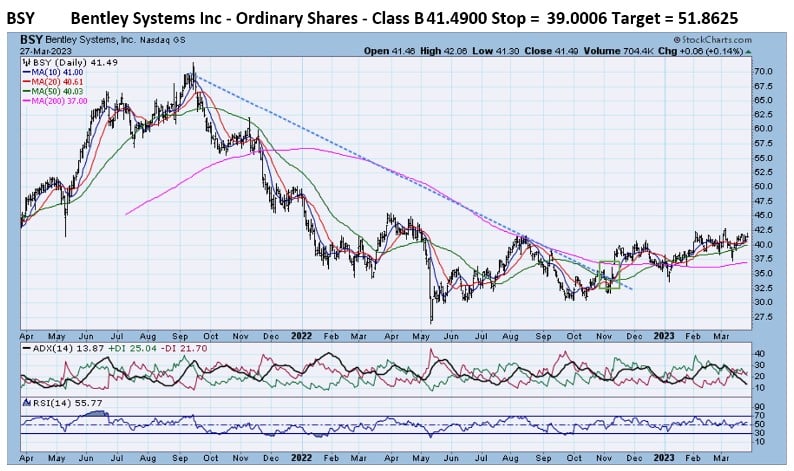
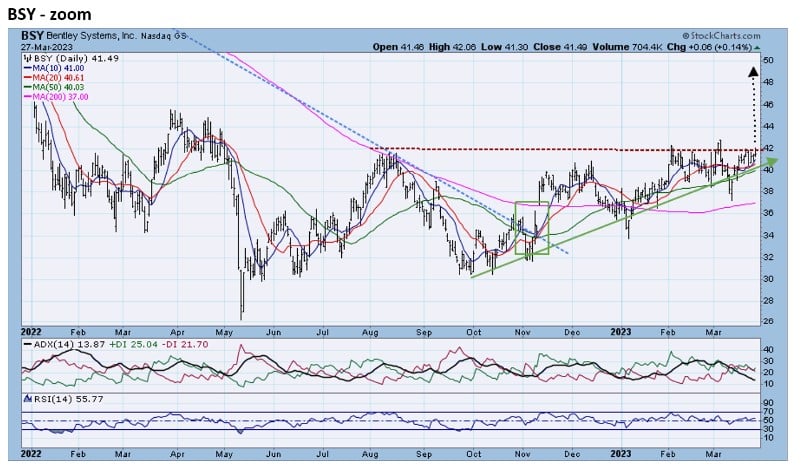
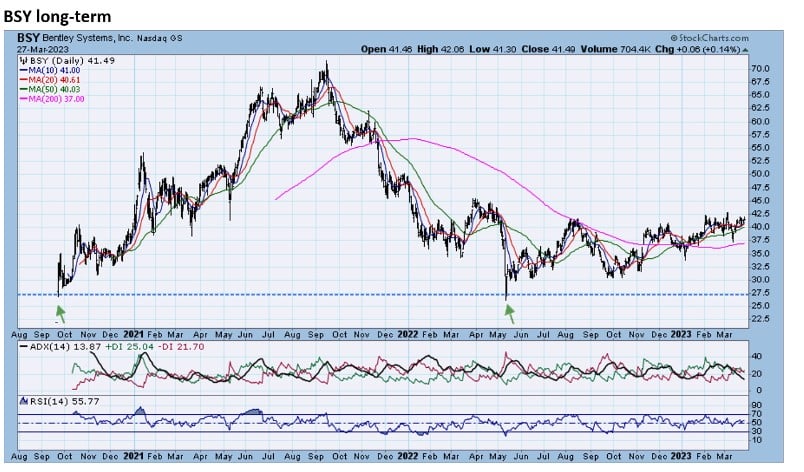
- BSY rose above its 14-month downtrend line in November 2022. BSY had declined 60% from its September 2021 highs to its May 2022 lows. The zoom chart reveals that BSY is not only in an uptrend, it has formed a potentially powerful ascending triangle pattern. The uptrend and seeming resistance at the 42 level should eventually result in a powerful breakout. ASCENDING – DESCENDING TRIANGLE (see TPA explanations of many technical formations at the bottom of the report). The long-term chart shows that the low in May 2022 matches the initial lows in 2020 and create a base for further gains.
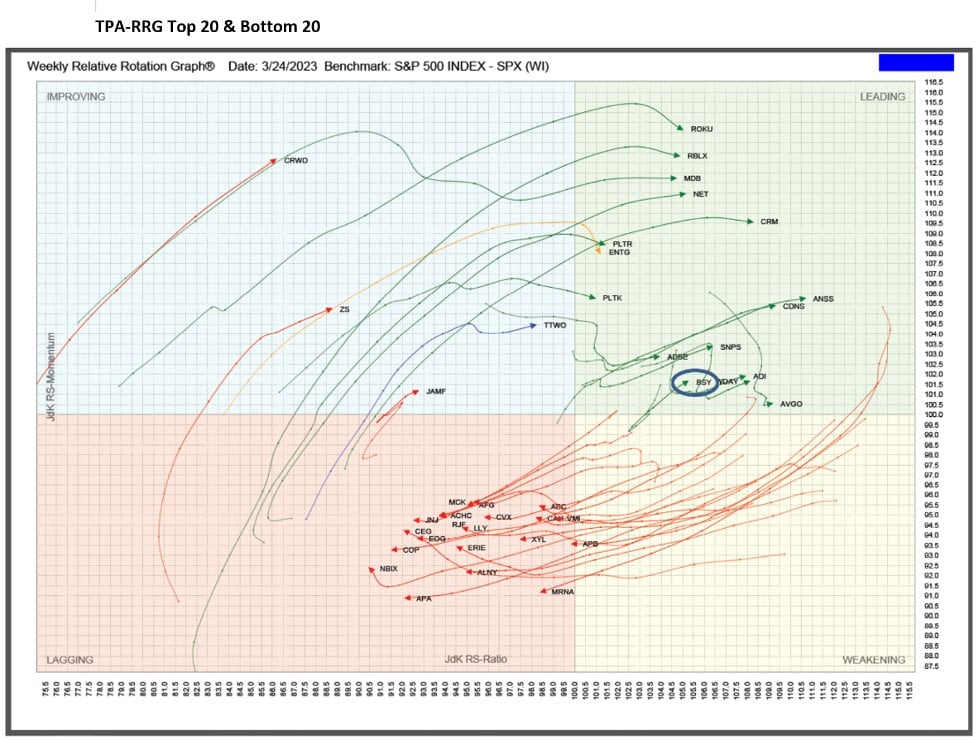
RRG analysis shows that BSY has moved into the Leading quadrant. BSY is one of this week’s Top 20 stocks in the TPA-RRG report.
Relative Rotation Graphs (RRG) – explanation video


Jeff Marcus founded Turning Point Analytics (TPA) in 2009 after 25 years on trading desks and 13 years as a head trader to provide strategic and technical research to institutional clients. Turning Point Analytics (TPA) provides a unique strategy that works as an overlay to clients’ good fundamental analysis. After 10 years of serving only large institutions, TPA now offers its research services to mid and small managers, RIA’s, and wealthy sophisticated individuals looking for a way to increase their returns and outperform their peers.
Subscribe 2 Week Trial
Customer Relationship Summary (Form CRS)