


Inside This Week’s Bull Bear Report
- Market Correction Has Started
- Bullish Signal Vs. Bearish Outlooks
- How We Are Trading It
- Research Report – Is The Fed Trying To Wean Markets Off Monetary Policy
- Youtube – Before The Bell
- Stock Of The Week
- Daily Commentary Bits
- Market Statistics
- Stock Screens
- Portfolio Trades This Week
Market Correction Has Likely Started
In last week’s message, we discussed the bullish signals the market was giving despite the Fed’s continued hawkish stance on monetary policy.
The market surge continued last week but ran into resistance on Friday as markets are pushing well into 3-standard deviations above the 50-DMA. However, while the weakness on Friday was not unexpected, it is also necessary to determine whether the current breakout is legitimate.
If the “bear market” is “canceled,” we will know relatively soon. To confirm whether the breakout is sustainable, thereby canceling the bear market, a pullback to the previous downtrend line that holds is crucial. Such a pullback would accomplish several things, from working off the overbought conditions, turning previous resistance into support, and reloading market shorts to support a move higher. The final piece of the puzzle, if the pullback to support holds, will be a break above the highs of this past week, confirming the next leg higher. Such would put 4300-4400 as a target in place.
A break BELOW the downtrend line, and the current intersection of the 50- and 200-DMA, will suggest the breakout was indeed a “head fake.” Such will confirm the bear market remains, and a retest of last year’s lows is likely.
The commentary remains vital to this week’s analysis as our primary short-term “sell” indicator has been triggered for the first time since early December. While that sell signal does NOT mean the market is about to crash, it does suggest that over the next couple of weeks to months, the market will likely consolidate or trade lower. Such is why we reduced our equity risk last week ahead of the Fed meeting.
The previous analysis remains crucial heading into next week. There are currently multiple levels of support for the S&P 500, as shown in the chart below.
- 4045 is the downtrend line from the June and December rally peaks (dotted black line)
- 4010 is the previous 38.2% retracement level from the October lows.
- 3969 is the rising 50-DMA moving average which has now crossed above the 200-DMA (orange line)
- 3942 is the intersection of both the neckline of the inverse head-and-shoulders bottoming pattern and the 200-DMA (black line)

If the market violates all of those supports, such will suggest the “bear market” remains intact and the rally from the October lows was another “head fake.”
However, the underlying technicals remain bullish until those support levels are violated. A correction that works off the overbought condition and tests and holds support will add further support to the bullish thesis.
The one certainty is that since January, the market has resembled the next Fast & Furious movie title: “Too Far, Too Fast.” Furthermore, retail investor sentiment has become increasingly bullish, suggesting a near-term correction is likely.
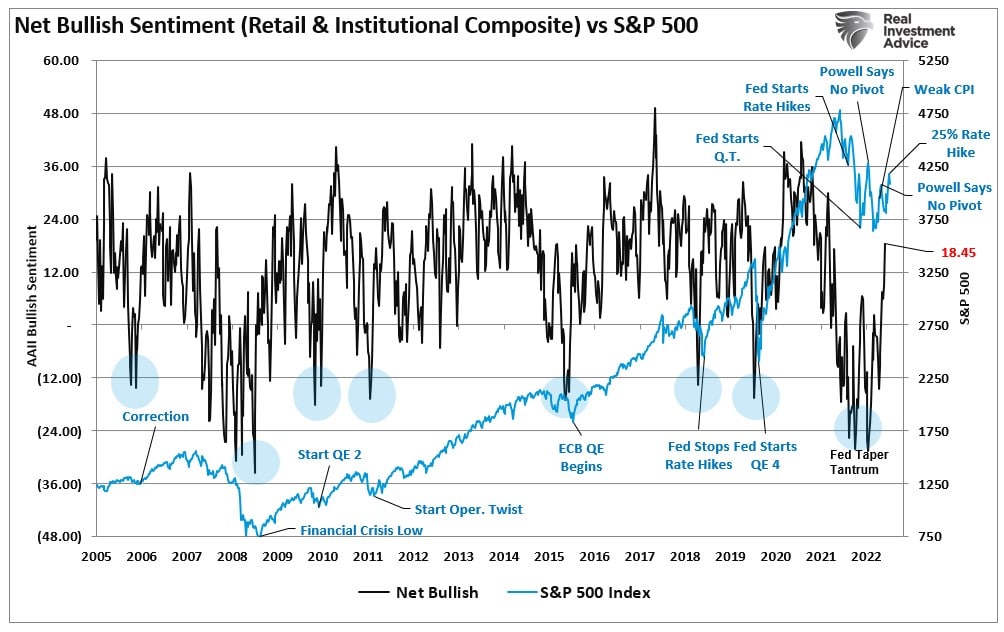
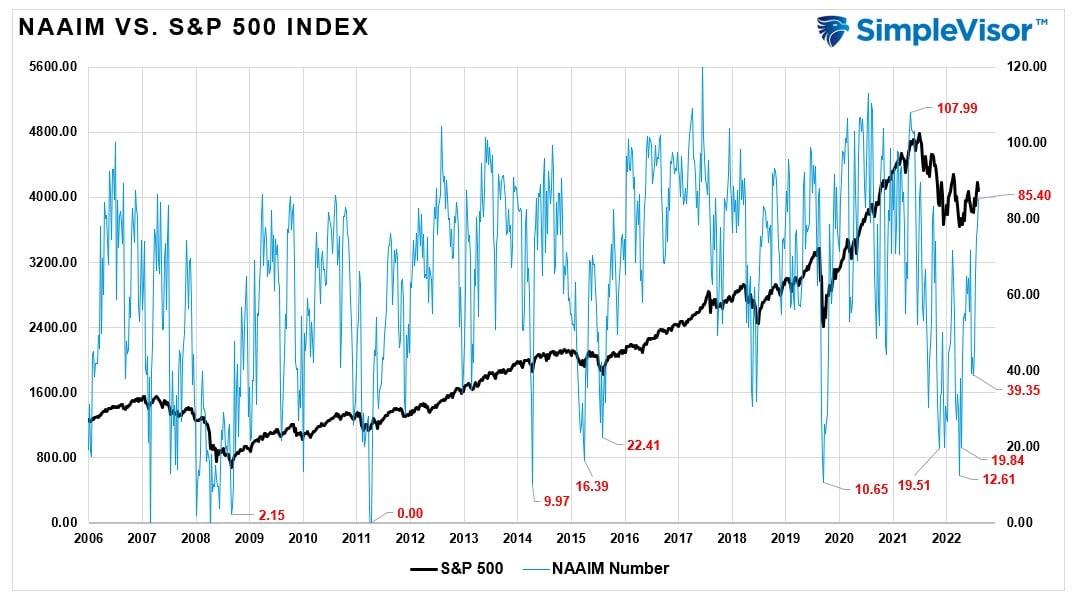
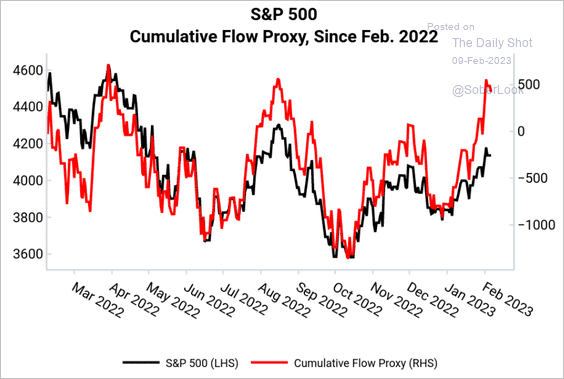
Also, professional investors have piled into the market in recent weeks, pushing exposures to more bullish levels.
In the near term, a correction is needed to work off the froth of the market and allow the bulls a chance to prove their case. However, in today’s missive, we will delve further into the debate between the bearish arguments and the bullish signals.
Need Help With Your Investing Strategy?
Are you looking for complete financial, insurance, and estate planning? Need a risk-managed portfolio management strategy to grow and protect your savings? Whatever your needs are, we are here to help.

The Bearish Argument Has Merit
On Tuesday, we discussed the short-term technical improvement versus the underlying fundamentals. While the short-term technicals are indeed bullish, the longer-term fundamentals don’t currently support the improvement. In that article, we quoted Greg Feirman:
“It all sets up for a showdown in the coming weeks. My contention is that “the market is a voting machine in the short term, and a weighing machine in the long term” (Ben Graham). That is, the price will follow the crowd in the short term, but the crowd will follow fundamentals in the long term. So while the market may continue to rally in the days and weeks ahead, eventually, this rally will peter out, and we will look back at it as just another bear market rally. If you’re interested in this debate between technicians and fundamentalists, pay attention because we’re all about to learn something one way or another.”
As we noted, Greg is correct.
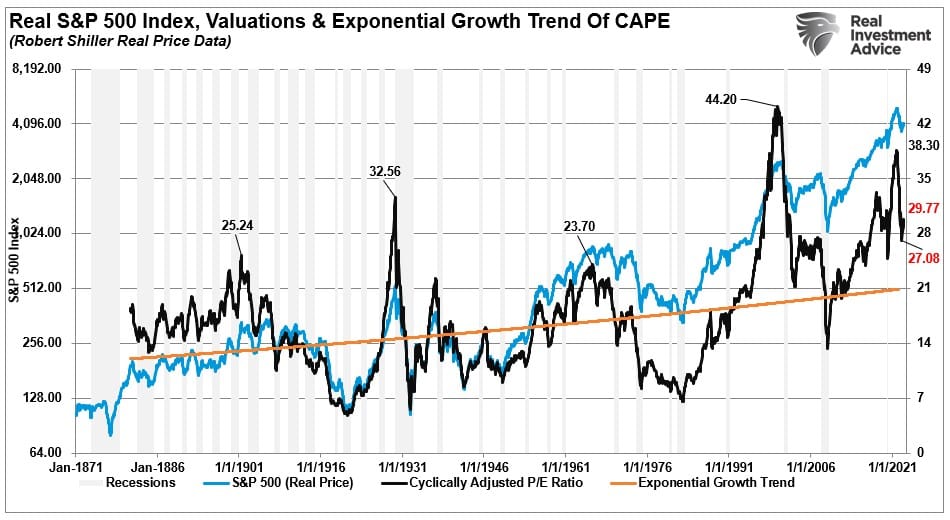
Since the beginning of the year, the rise in the market has been purely a function of valuation expansion as both earnings, and earnings estimates, continue to deteriorate. As shown, valuations are rising to 29x, trailing real earnings, which is historically expensive.
However, it isn’t just expanding valuations supporting the bearish outlooks. The laundry list of reasons to “be bearish” is quite compelling:
- Earnings and forward estimates are declining.
- Inflation, while declining, is still running well above 5%, which has preceded every recession in history.
- The Federal Reserve is still hiking interest rates, albeit slower.
- The market continues to ignore liquidity contraction as the Federal Reserve reduces its balance sheet (QT).
- Economic growth is slowing.
- The consumer, which comprises ~70% of GDP, is struggling to make ends meet.
- With inflation falling, corporate profit margins will contract.
- Unemployment at very low levels has always preceded a recession and valuation contraction.
That last point is shown below. Note that extremely low levels of unemployment are historically pre-recessionary. Such seems illogical; if everyone is working, then a “recession” would seem unlikely. However, record-low unemployment levels signify the economic cycle is as “good as it can get.” That is also the part of the cycle where cost pressures rise, profitability declines, and layoffs begin. Notably, during those economic reversions, valuations also decline.

Yet, despite these sound bearish arguments, the “bullish signals” continue to improve.
Bullish Signals Persist
As we have discussed over the past couple of weeks, the bullish market signals continue to build. However, while many have dismissed the bullish signals as short-covering or speculative market chasing, an intermediate picture is also improving.
Regarding technical analysis, looking at daily price charts can provide a short-term view of market psychology from a few days to a few weeks. The problem with daily price analysis is that volatility can cause short-term swings in the market that may disconnect from the market’s underlying trend or fundamental data.
However, suppose we slow that price action down by examining weekly pricing data. That short-term volatility gets smoothed out, revealing a clearer picture of what the market is trying to tell us. Currently, the market is delivering a more bullish message.
“The S&P 500 has scored four weekly closes above its 13-, 26- and 40-week MAs from 3978 to 3915, which is a positive sign. In addition, the SPX has cleared its three milestone resistances: the 40-week MA, downtrend line from January 2022 and December 2022 lower high to suggest a potential bullish turn in trend. These prior resistance reverse roles and offer key supports at 4100 (December lower high), 3960 (downtrend line) and 3939 (40-week MA) along with the zone of weekly MAs from 3978 to 3915. If supports hold, the next major resistance beyond last week’s post FOMC peak at 4195 comes in at the August 2022 peak at 4325.”- Bank of America
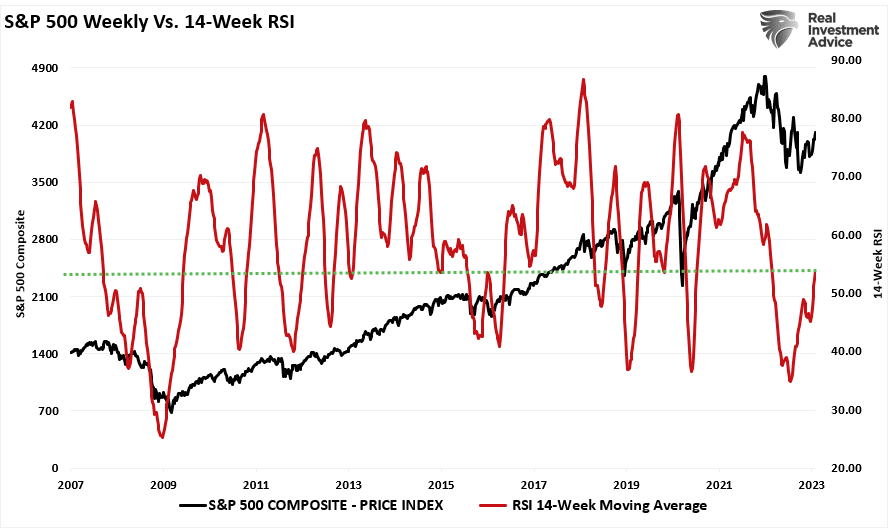
The chart below is a weekly price chart of the S&P 500, and as BofA notes, the market cleared the 40-week moving average, which was apparent resistance during the entirety of 2022. Furthermore, the October low held support at the 200-week moving average, which remains support for the market since the 2009 lows.
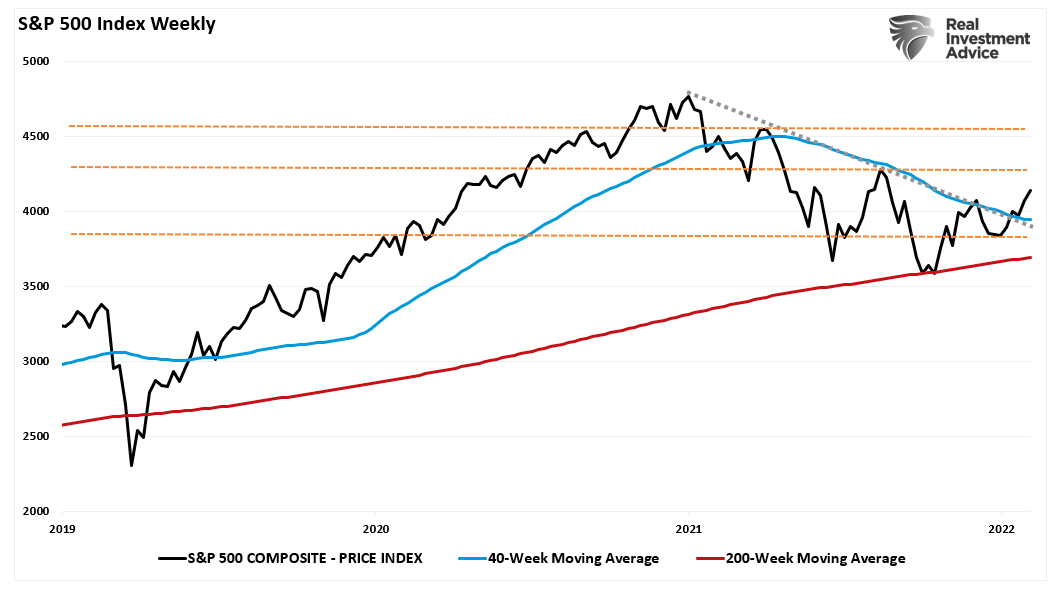
Furthermore, the weekly 14-period relative strength index (RSI) has also turned sharply positive and is above 50, suggesting markets are back in a bullish trend.
“Intermediate-term price momentum for the SPX as measured by the 14-week RSI also broke above the key resistances that capped bear market rallies in April, August and December 2022. This bullish momentum breakout provides a potential positive leading indicator for a 2023 breakout for the SPX above its August 2022 peak at 4325.” – BofA
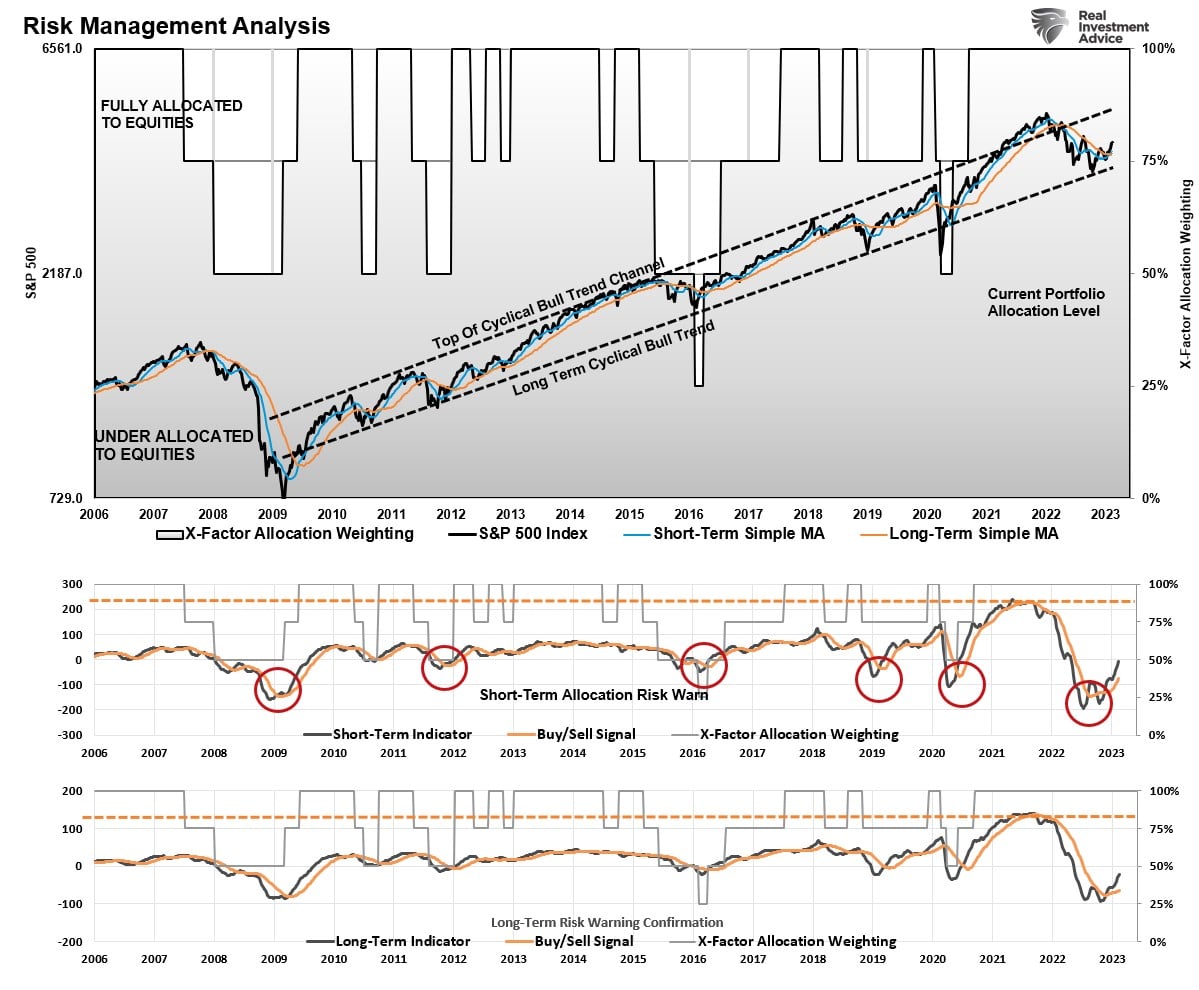
Lastly, one of our most critical bullish signals is the short- and intermediate-term Moving Average Convergence Divergence (MACD) indicators. We post this weekly chart in our website’s 401k plan management section. Both sets of weekly MACD indicators have registered buy signals from levels lower than during the financial crisis. The market has also broken above both weekly moving averages and, as noted above, held the long-term bullish trend line.
Given the abundance of bullish signals, we must give some credence to the message and invest accordingly. However, ample evidence supports the argument that the “bear market” may not be dead.
The Bear May Not Be Dead Yet
The market is back to more extreme overbought levels in the short term. As I noted on Twitter Friday, the market is getting frothy with the CNN Fear/Greed gauge back to more extreme levels of “greed.” (Chart courtesy of Albert Edwards)

Furthermore, I agree that much of the rally since the beginning of the year has been a short-covering momentum chase which now seems to be approaching exhaustion.
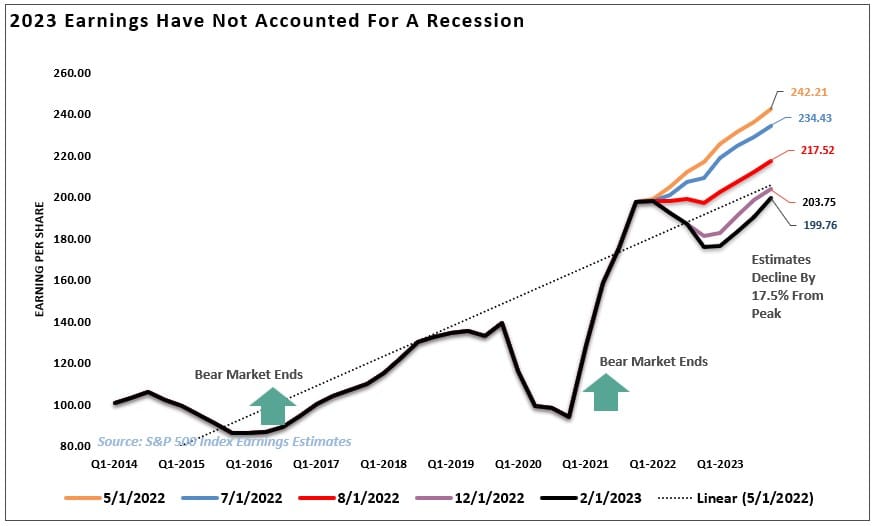
Furthermore, the earnings season has not been stellar. As I pointed out on Tuesday, earnings have declined 17.5% from the May 2022 peak, but analysts remain optimistic about a near-term economic recovery story.
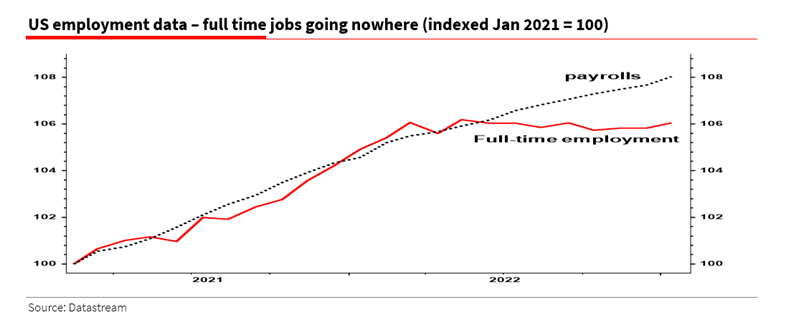
Given the Fed is continuing to hike interest rates aggressively, the economic recession story still has validity. Yield curves remain deeply inverted, the economic indicators remain weak, and the only support currently remains a strong jobs report. However, as David Rosenberg noted last week, despite solid payroll numbers, ZERO net full-time employment gains have occurred since last May. Temporary jobs do not support a more robust economy, so a downturn remains possible.
This is the confusing part. On the one hand, bullish signals flash that the bear market is over. However, on the other, the fundamental data screams caution that the bear market is not dead yet. Let me conclude with a note from Simon White via Bloomberg:
“Optically flattering economic data, a still-positive real-yield curve, and contracting liquidity together show that stocks remain entrenched in a bear market.
In general, when the real-yield curve is much steeper than average and real money (M2) growth is negative – as it is today – it leads to significant equity underperformance. (When these conditions are met, the S&P has an average year-on-year nominal return of 2.9% over the next three months, versus the overall average (going back to 1962) of 7.8%. Over the subsequent six months the average nominal return is also lower than 7.8%, at 4.8%).”
The problem for investors is the dichotomy of bullish signals and bearish fundamentals. In the long term, the fundamentals always win, but in the short-term, opportunity exists.
How you trade that is the challenging part.
How We Are Trading It
I concluded Tuesday’s post with the answer:
“So, what should an investor due with such a dichotomy? The answer is more simple than it seems.
The market can defy economic and fundamental realities. In the short term, the market is a ‘voting machine.’ In other words, the market will respond to the ‘votes’ of the herd in the market. However, the market will ‘weigh’ the fundamental measures and price accordingly over the longer term.“
While the awaited correction has begun, this will be a critical moment for the markets. If the bulls are going to remain in control, support must hold. If not, the bears will regain control of the narrative once again. For the moment, the bullish signals suggest an increase in equity risk. However, we need a set of rules to navigate whatever happens next.
- Cut losers short and let winners run. (Be a scale-up buyer into strength.)
- Set goals and be actionable. (Without specific goals, trades become arbitrary and increase overall portfolio risk.)
- Emotionally driven decisions void the investment process. (Buy high/sell low)
- Follow the trend. (The long-term, monthly trend determines 80% of portfolio performance. While a “rising tide lifts all boats,” the opposite is also true.)
- Never let a “trading opportunity” turn into a long-term investment. (Refer to rule #1. All initial purchases are “trades” until your investment thesis is proved correct.)
- An investment discipline does not work if it is not followed.
- The odds of success improve significantly when the technical price action confirms the fundamental analysis. (This applies to both bull and bear markets)
- Markets are either “bullish” or “bearish.” During a “bull market,” be only long or neutral. During a “bear market,” be only neutral or short. (Bull and Bear markets are determined by their long-term trend)
- When markets are trading at, or near, extremes do the opposite of the “herd.”
- Do more of what works and less of what doesn’t (Traditional rebalancing takes money from winners and adds it to losers. Rebalance by reducing losers and adding to winners.)
Don’t Pick A Side
Set aside the idea of being either “bullish” or “bearish.” Once you pick a side, you lose objectivity to what is occurring within the market.
How long with the technical bull run last? I have no idea.
But when it ends, and the fundamentals begin to re-emerge, we will have plenty of warning to adjust accordingly.
As I stated last week:
“As portfolio managers, we must trade the market we have, not the one we want. For the moment, we are in a “bull market.” As noted, the “bear market” of 2022 has been canceled, but most likely not permanently. With the market overbought short-term and getting well deviating from underlying moving averages, we are maintaining our underweight equity positioning.”
Such is the point where we are today. The technical improvements in the market suggest investors should be buying. It’s hard. It also doesn’t mean it will immediately work, as the markets could correct first before the final bottom. Until the technical backdrop tells us differently, we are back to “buying dips.”
On a pullback to support, we will bring our allocations up to full weightings and raise stops accordingly.
But that doesn’t mean we won’t eventually return to being net sellers.
Have a great week.
Research Report

Subscribe To “Before The Bell” For Daily Trading Updates (Formerly 3-Minutes)
We have set up a separate channel JUST for our short daily market updates. Be sure and subscribe to THIS CHANNEL to receive daily notifications before the market opens.
Click Here And Then Click The SUBSCRIBE Button
Subscribe To Our Youtube Channel To Get Notified Of All Our Videos
Stock Of The Week In Review
If nothing caught your eye in last week’s screen of the Cathy Wood’s ARKK ETF, Going for Growth, perhaps something in this week’s screen will. Small-cap growth has been in contention for the best performing factor this year based on our analysis of factor performance.
While mid-cap growth hasn’t provided much outperformance YTD, one might expect it to begin closing the gap sooner rather than later. Thus, we screen for small and mid-cap growth stocks this week with an eye towards proven consistency of growth.
Here is a link to the full SimpleVisor Article For Step-By-Step Screening Instructions.
Here is one of the companies we screened.

Login to Simplevisor.com to read the full 5-For-Friday report.
Daily Commentary Tidbits
Yellen Says No Recession On The Horizon
Yesterday, U.S. Treasury Secretary Janet Yellen stated: “You don’t have a recession when you have the lowest unemployment rate in 53 years.” While such a statement sounds logical, history argues a recession could be right around the corner despite record-low unemployment. Janet Yellen may want to study the graph below closely. The unemployment rate always hits a cycle low within a few months of the beginning of the recession.
The latest round of economic data remains robust, and to Yellen’s point, a recession seems very unlikely. However, the Fed has hiked rates at the fastest pace in over forty years, and today’s economy is much more sensitive to interest rates than at any time in the past. The lag effects of tighter monetary policy are real and have yet to be fully felt. Maybe Yellen will be correct, and we get a soft landing, but maybe record-low unemployment again precedes a recession.

Click Here To Read The Latest Daily Market Commentary (Subscribe For Pre-Market Email)
Bull Bear Report Market Statistics & Screens

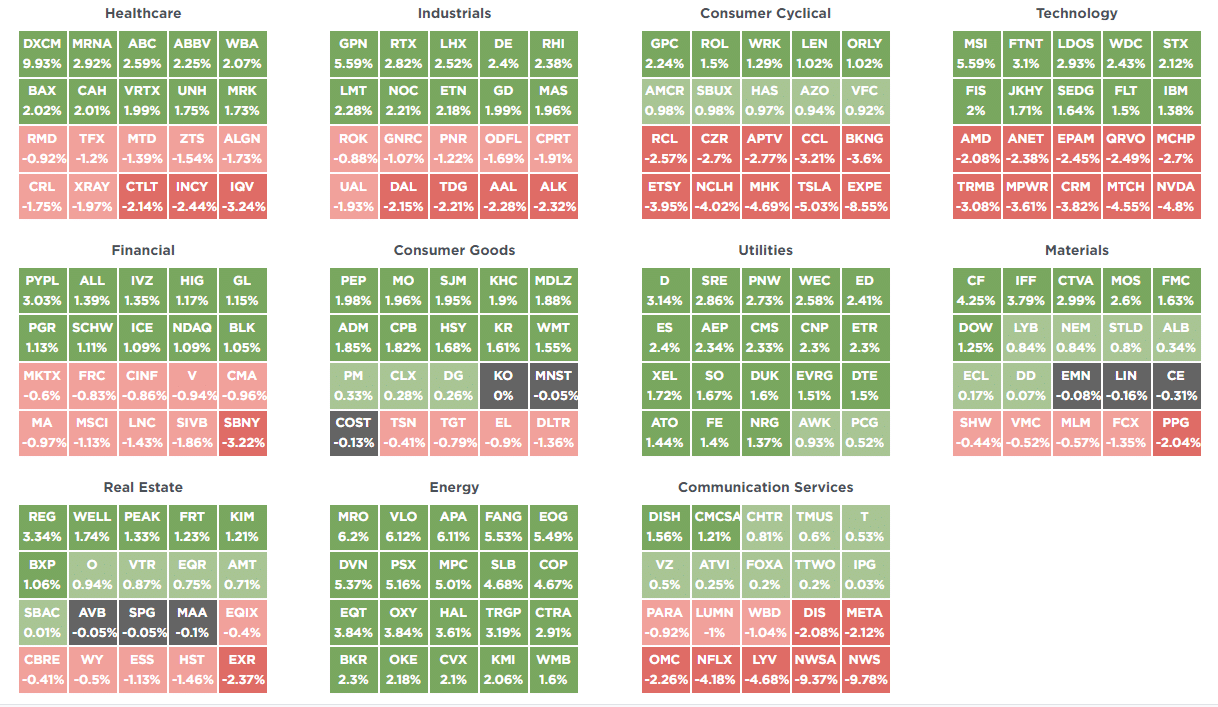
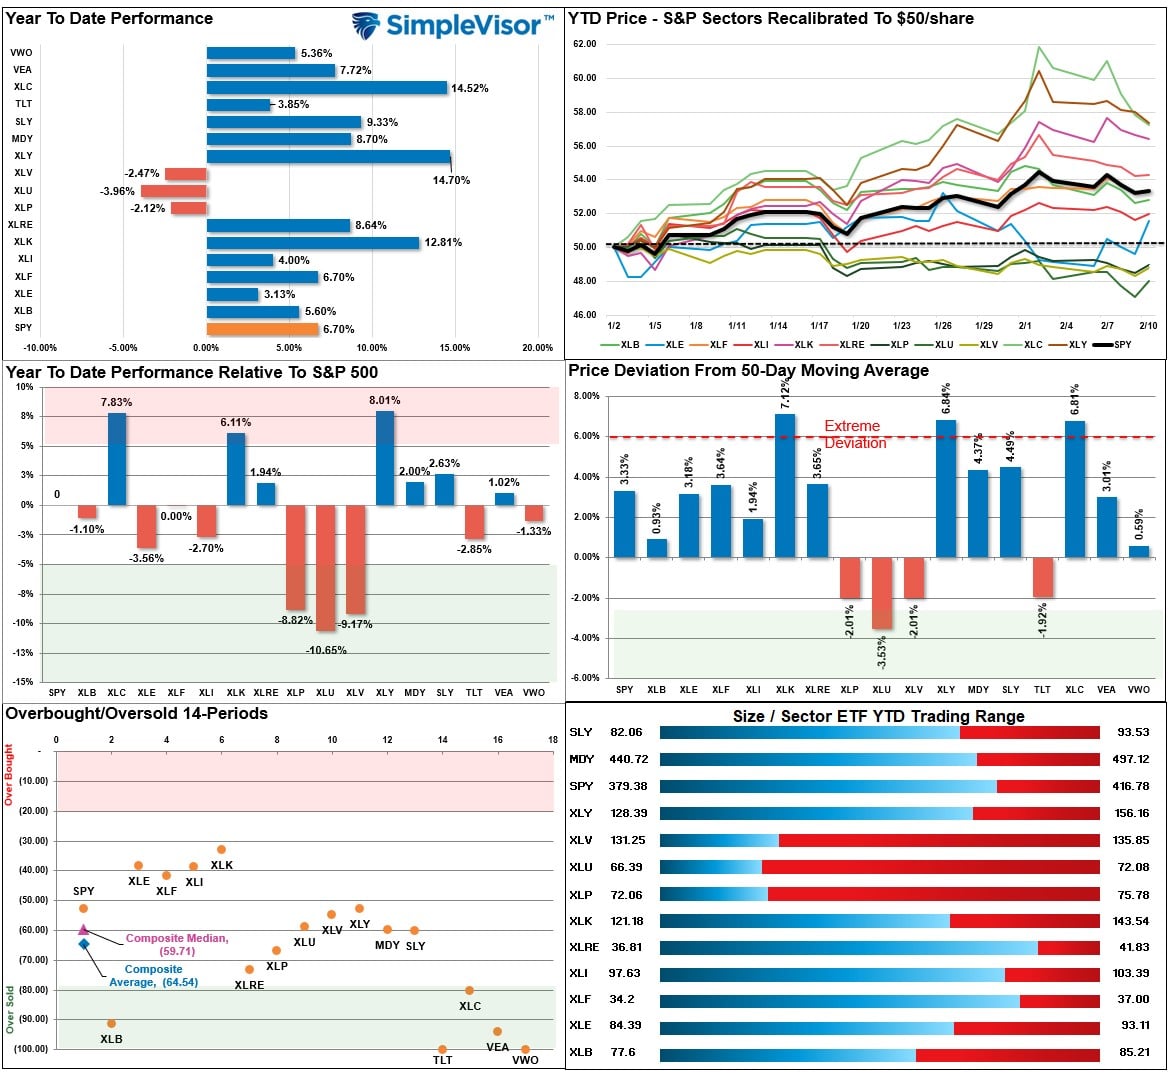
SimpleVisor Top & Bottom Performers By Sector
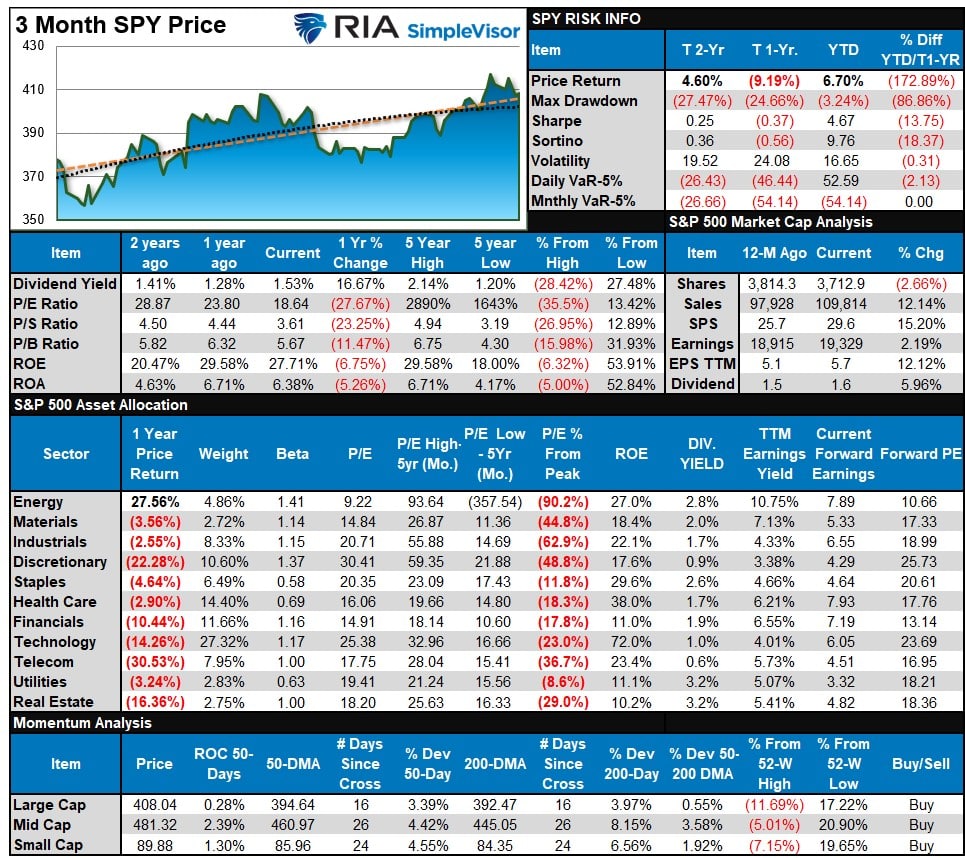
S&P 500 Weekly Tear Sheet
Relative Performance Analysis
As we stated last week:
“With many sectors and markets trading well above normal monthly ranges (see risk range report below), look to take some profits and rebalance risk. We will likely have a short-term market correction within the next week or two.“
That correction started this past week with our MACD “sell signal” triggering, and a clear rotation began from leaders to laggards. Communications, Technology, and Discretionary remain well deviated above the 50-DMA, suggesting there is more work to be done, which gives Staples, Utilities, and Healthcare an opportunity to gain as money seeks relative safety. The market is NOT oversold yet, so I expect this correction to continue next week.
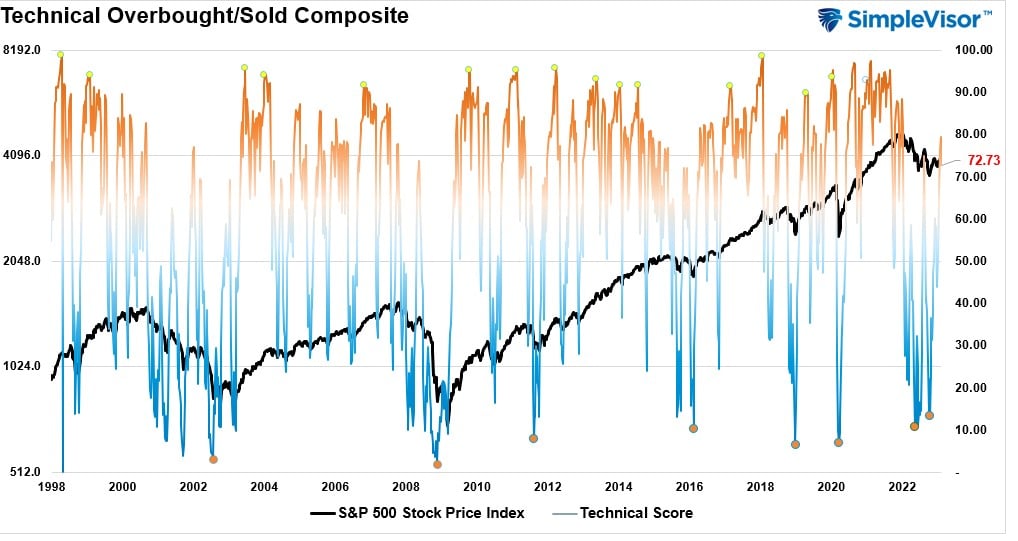
Technical Composite
The technical overbought/sold gauge comprises several price indicators (RSI, Williams %R, etc.), measured using “weekly” closing price data. Readings above “80” are considered overbought, and below “20” are oversold. Markets tend to peak when those readings are at 80 or above, which suggests profit-taking and risk management are prudent. The best buying opportunities exist when those readings are 20 or below.
The current reading is 72.73 out of a possible 100 and rising. Remain long equities for now.
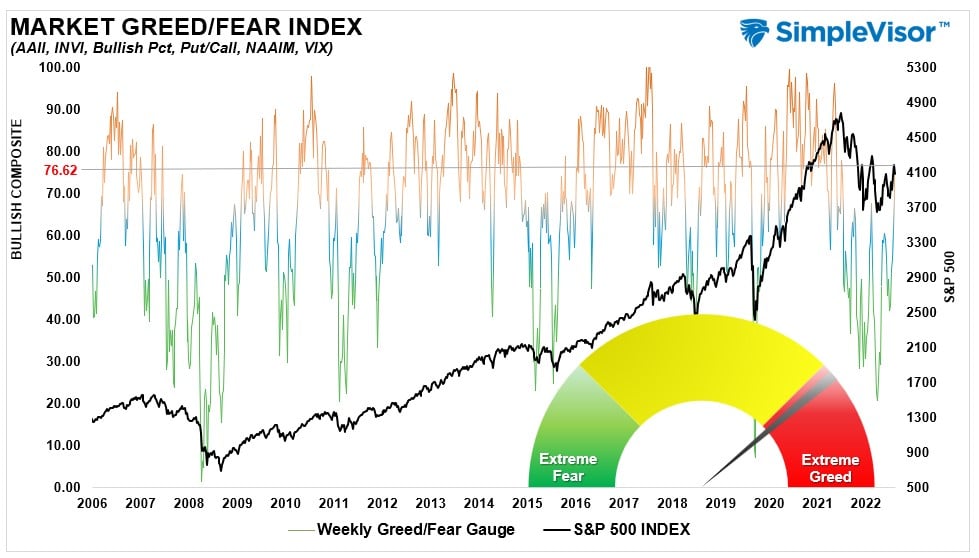
Portfolio Positioning “Fear / Greed” Gauge
The “Fear/Greed” Gauge is how individual and professional investors are “positioning” themselves in the market based on their equity exposure. From a contrarian position, the higher the allocation to equities, the more likely the market is closer to a correction than not. The gauge uses weekly closing data.
NOTE: The Fear/Greed Index measures risk from 0 to 100. It is a rarity that it reaches levels above 90. The current reading is 76.62 out of a possible 100.
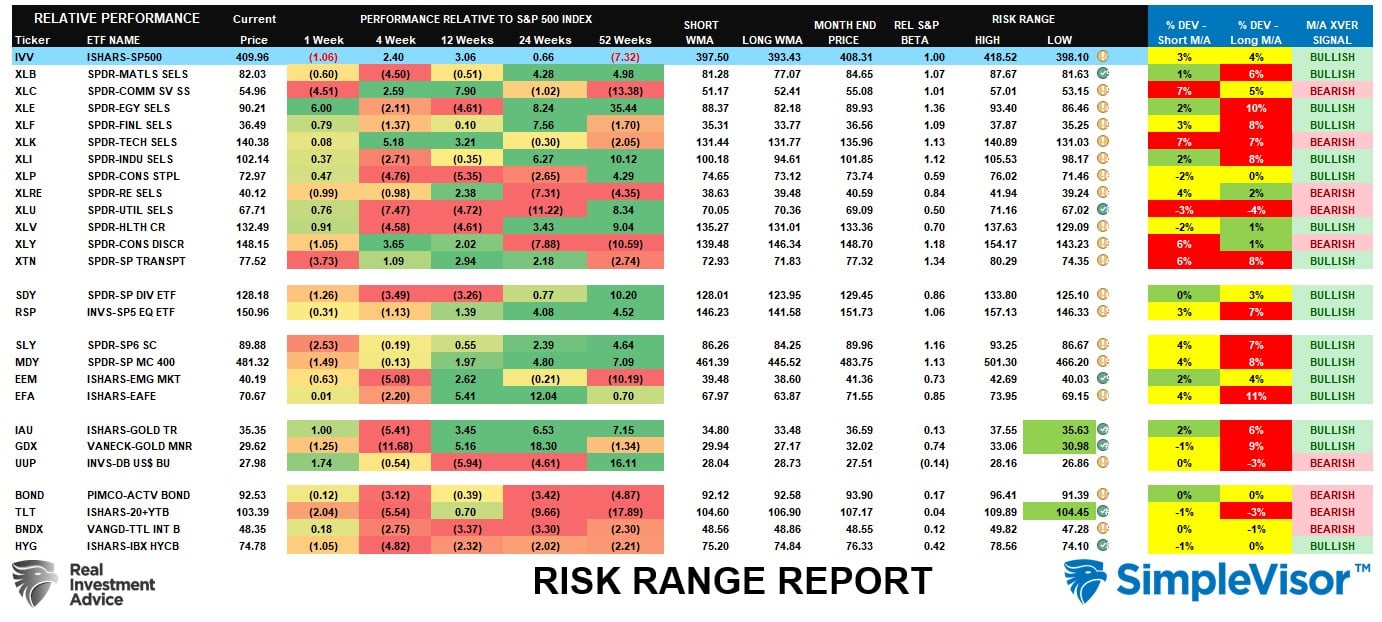
Sector Model Analysis & Risk Ranges
How To Read This Table
- The table compares the relative performance of each sector and market to the S&P 500 index.
- “M” XVER” “Moving Average Cross Over) is determined by the short-term weekly moving average crossing positively or negatively with the long-term weekly moving average.
- The risk range is a function of the month-end closing price and the “beta” of the sector or market. (Ranges reset on the 1st of each month)
- The table shows the price deviation above and below the weekly moving averages.
As noted last week, “Continue to look for pullbacks in areas where you want to add exposure and ‘buy dips’ accordingly.” Communications, Technology, and Transportation are already trading outside their normal risk ranges in the first 3-days of the month. They have started to correct. Bonds and Gold started the month with a correction. Look to add exposure to sectors that are strengthening in terms of relative performance (moving from red bands towards green over the previous weekly periods) and are on bullish buy signals.
Weekly SimpleVisor Stock Screens
Each week we will provide three different stock screens generated from SimpleVisor: (RIAPro.net subscribers use your current credentials to log in.)
This week we are scanning for the Top 20:
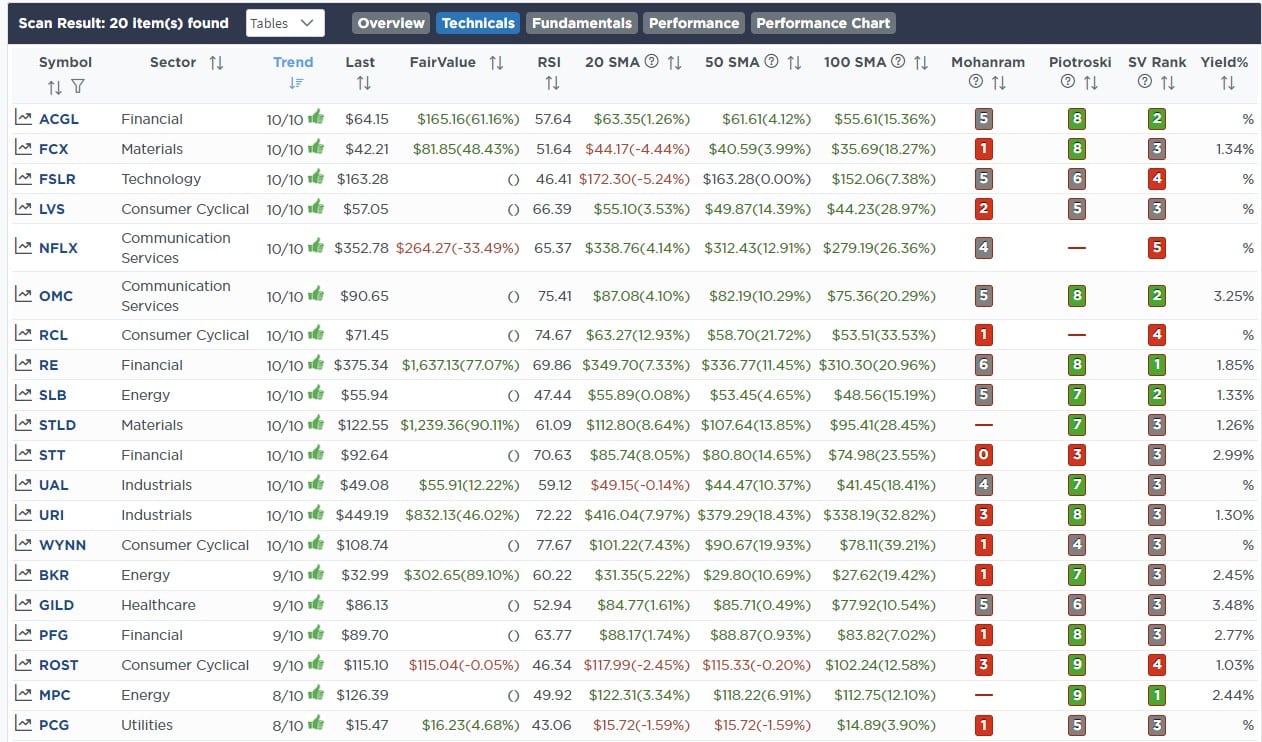
- Relative Strength Stocks
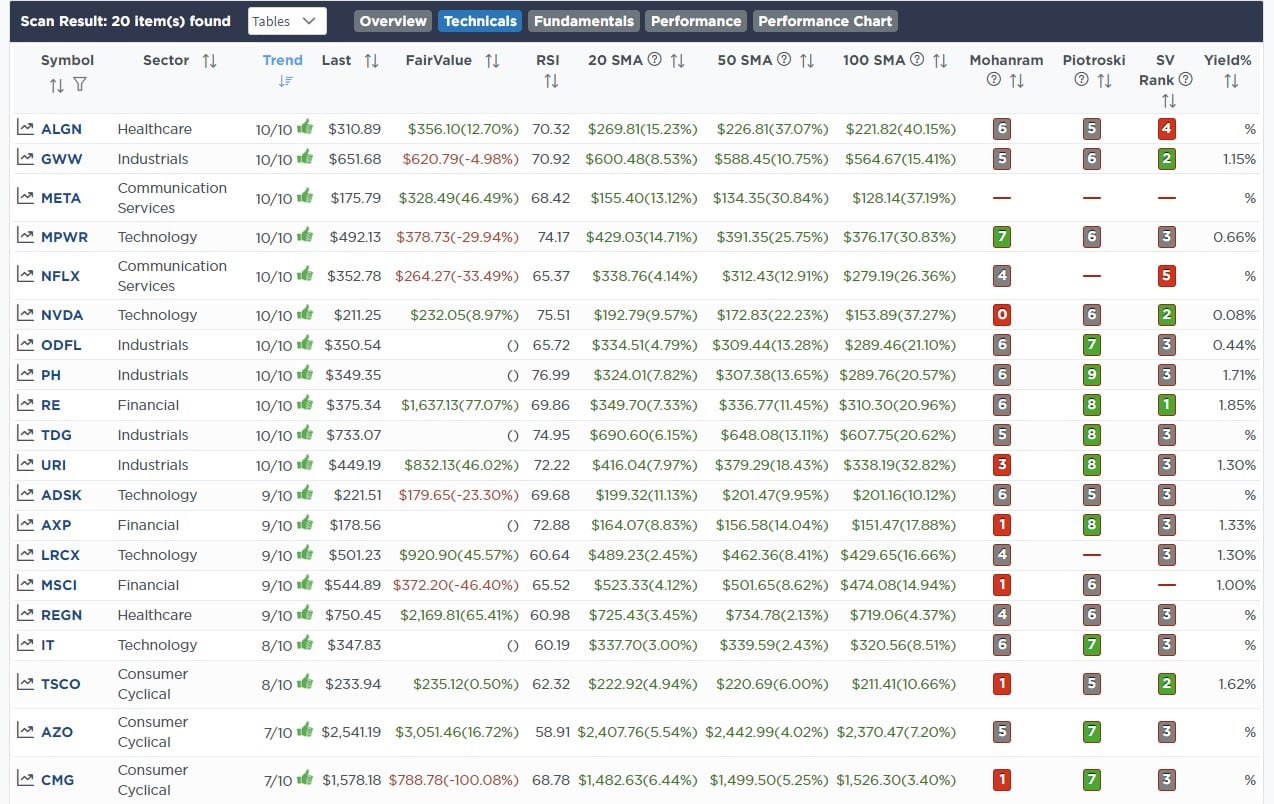
- Momentum Stocks
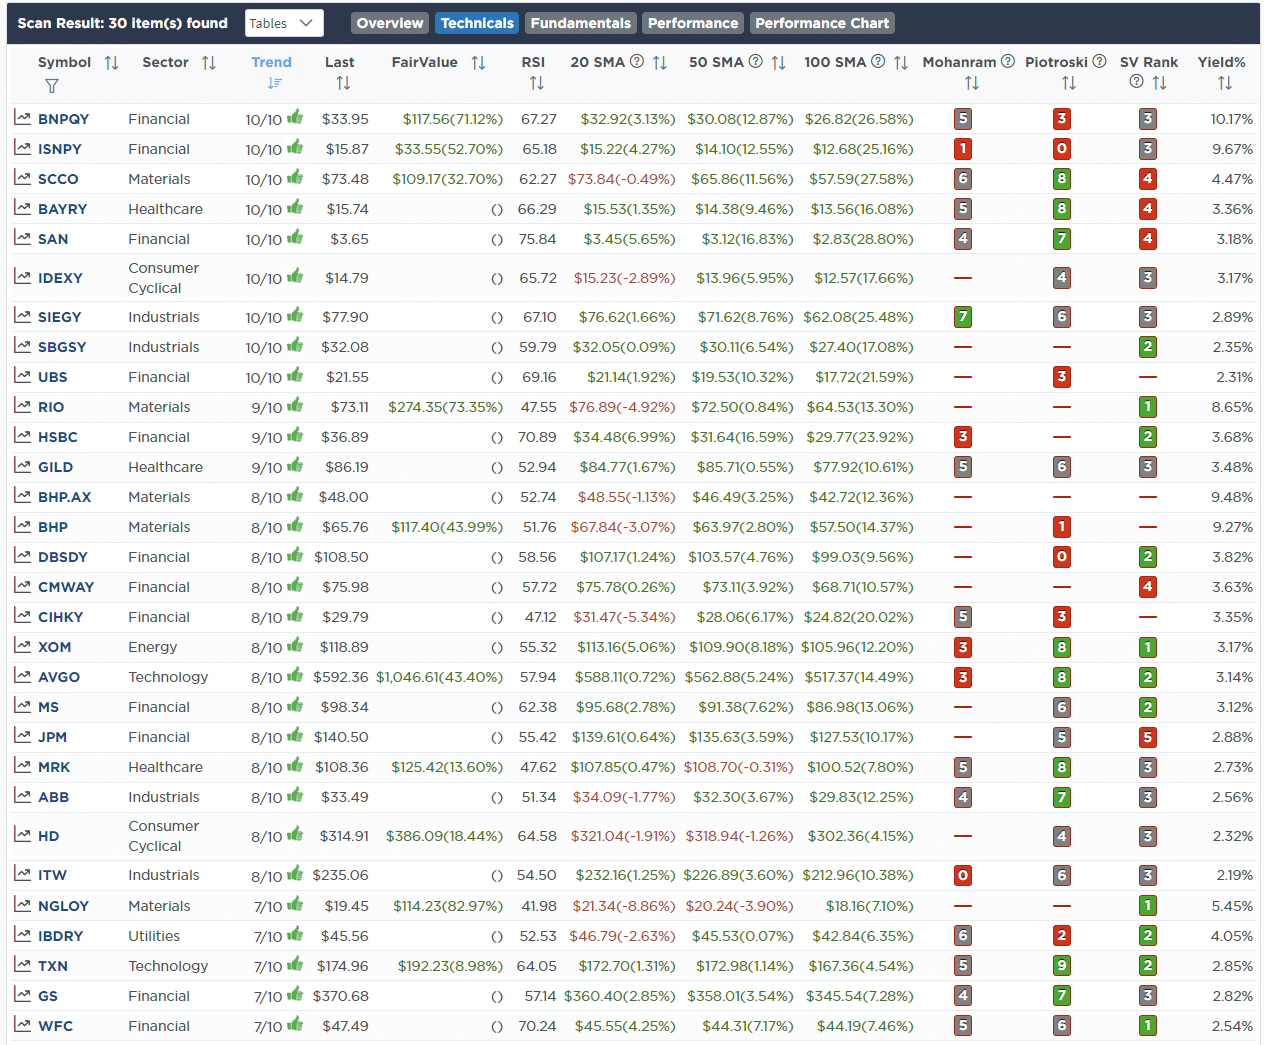
- Highest Rated Stocks With Dividends
These screens generate portfolio ideas and serve as the starting point for further research.
(Click Images To Enlarge)
RSI Screen
Momentum Screen
Highest Rated Stocks With Dividends
SimpleVisor Portfolio Changes
We post all of our portfolio changes as they occur at SimpleVisor:
February 7th
This morning we sold our stake in Goldman Sachs (GS) after a recovery rally following rather disappointing earnings results for the 4th-Quarter. While we like the investment bank longer-term, the near-term problems with its retail banking division may remain problematic for the rest of this year. We are taking our gains for now.
We are adding 1% of our portfolio to Nextera Energy (NEE) which has been under extreme selling pressure with the recent rise of interest rates. With the overall market overbought short-term, particularly technology, we expect a rotational trade back to risk-off soon. Such should benefit utilities which, like NEE, are extremely oversold.
Equity Model
- Sell 100% of Goldman Sachs (GS)
- Increase Nextera Energy (NEE) to 2% of the portfolio.

Lance Roberts, CIO
Have a great week!


Lance Roberts is a Chief Portfolio Strategist/Economist for RIA Advisors. He is also the host of “The Lance Roberts Podcast” and Chief Editor of the “Real Investment Advice” website and author of “Real Investment Daily” blog and “Real Investment Report“. Follow Lance on Facebook, Twitter, Linked-In and YouTube
Customer Relationship Summary (Form CRS)