


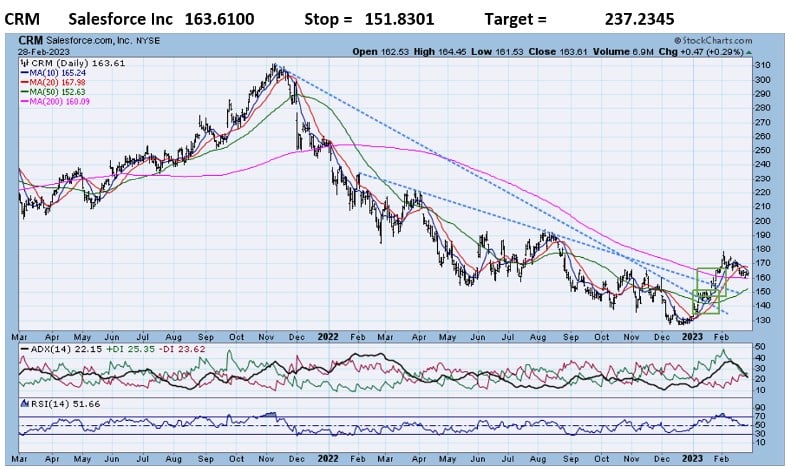
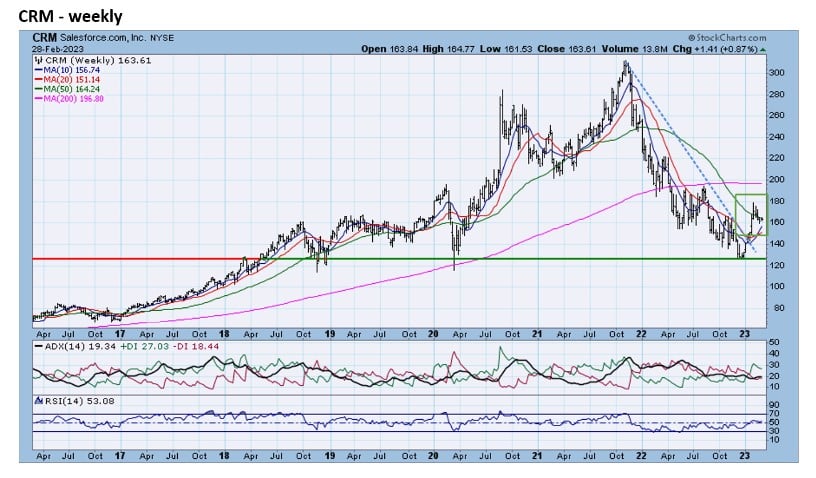
- CRM rose above its 2022 and its 12-month downtrend lines in January after falling more than 58% in a little more than a year. The zoom chart reveals that the late January breakout moved CRM above 5-month resistance around the 162 level. The weekly chart shows that the inflection point in December confirms long-term support.
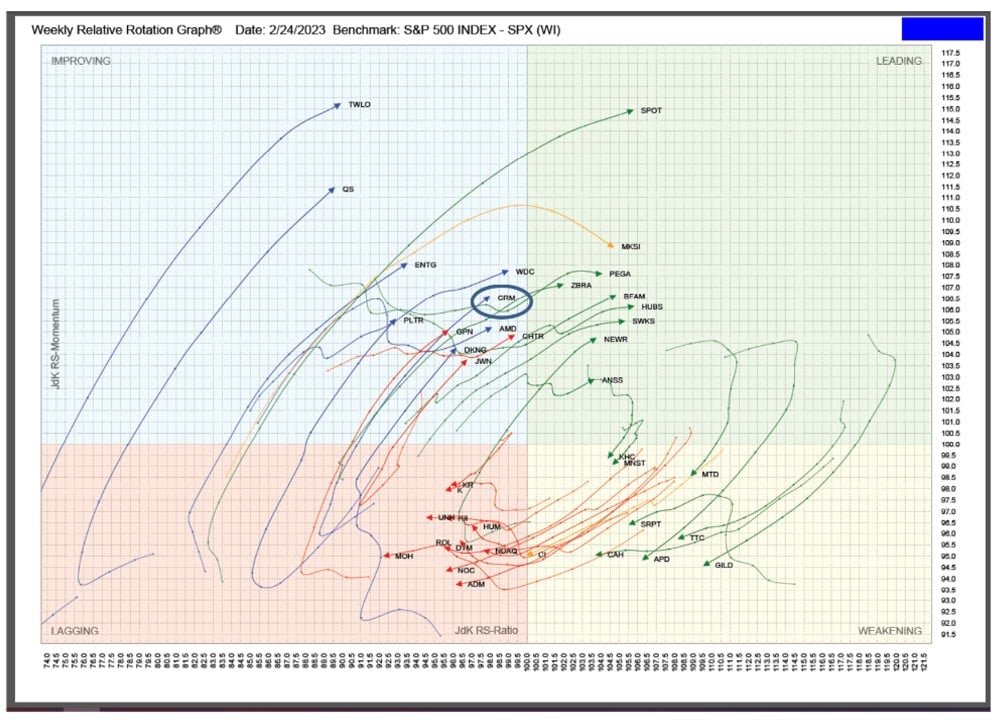
RRG analysis shows that CRM moved out of the Lagging quadrant, into the Improving quadrant and is headed toward the Leading quadrant. Both relative strength and relative momentum are improving. CRM was in the TOP 20 in this week’s TPA-RRG report – see RRG below.

Relative Rotation Graphs (RRG) – explanation video


Jeff Marcus founded Turning Point Analytics (TPA) in 2009 after 25 years on trading desks and 13 years as a head trader to provide strategic and technical research to institutional clients. Turning Point Analytics (TPA) provides a unique strategy that works as an overlay to clients’ good fundamental analysis. After 10 years of serving only large institutions, TPA now offers its research services to mid and small managers, RIA’s, and wealthy sophisticated individuals looking for a way to increase their returns and outperform their peers.
Subscribe 2 Week Trial
Customer Relationship Summary (Form CRS)