


Exxon (XOM)
As we stated in our review of RTX, XOM may also serve as a good portfolio hedge if hostilities in the Middle East worsen. The technical section below highlights that the price of crude oil and XOM tend to trade similarly. Therefore, if Iran becomes more involved and the U.S. and its allies ramp up military and/or economic pressure on Iran, the price of oil and XOM would likely rise as supply lessens.
Another consideration revolves around the oil demand. A Goldilocks/soft landing economic scenario will keep oil demand steady and likely support the price of crude oil and XOM. However, a recession will curtail oil demand and likely weigh on XOM’s price.
Fundamental
From 2010 through 2019, the average P/E was 17. The lowest during the period was in October 2011, at 9.41. Today it’s 9.29.
Its P/S is 1.10. Like P/E, it also trades at a good value, but unlike P/E, it is more in line with pre-pandemic levels.
EBITDA and operating profit margins are just below recent record highs. It appears investors are putting a low premium on future growth. Might the green revolution be weighing on XOM? Conversely, with some auto companies backing off the production of EVs, can XOM valuations improve with sharply forecasted declines in oil demand being far from a foregone conclusion? These are key fundamental questions investors should be asking themselves.
XOM pays a $3.80 dividend. It has steadily increased since at least 1993, making it a part of the sought-after “Dividend Aristocrats” set of securities. There has not been a dividend cut during this period. The current yield is close to 4%, in line with Treasury bonds.
XOM’s long-term debt to equity has been declining since 2020. Its long-term debt-to-equity ratio is low at 17.59. Solid cash flows and relatively low amounts of debt allow XOM to further its growth potential by purchasing oil-producing companies and properties.
Technical
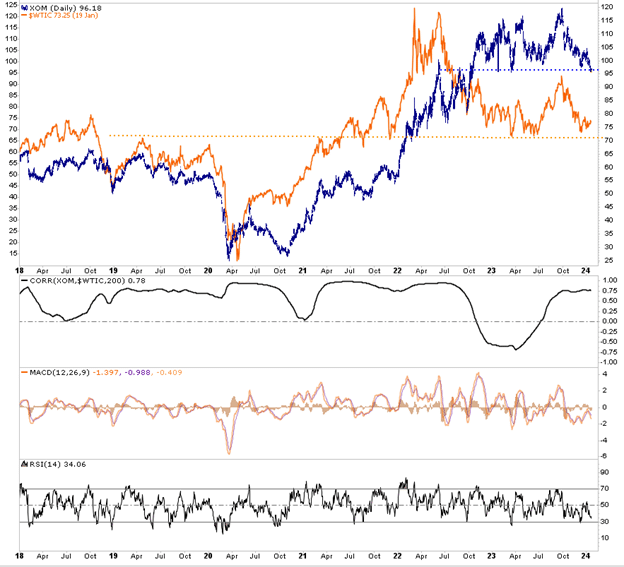
The top graph below compares the price of XOM to crude oil. The second graph shows the running 200-day correlation between the two. As both graphs demonstrate, the correlation between the two tends to be strong. The dotted lines show that XOM and crude oil are sitting on or near crucial support levels. A break below support of $70 a barrel for crude may correspond with a drop below $95 for XOM.
The two graphs at the bottom, MACD and RSI, show that XOM is currently oversold, albeit there is room for more downside in both gauges.
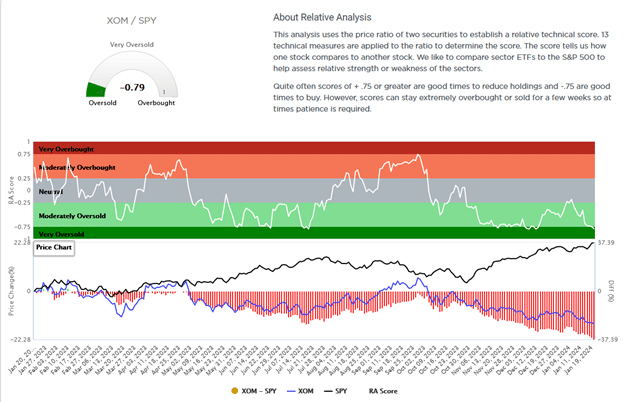
The second graphic shows our proprietary SimpleVisor relative analysis of XOM versus the S&P 500. Since May 2023, the S&P 500 (black) and XOM (blue) have moved in opposite directions. Currently, XOM has a relative score of -0.79, which is deeply oversold. While this may be a good buying opportunity, the score can stay low for a while, meaning XOM may continue to underperform the market.
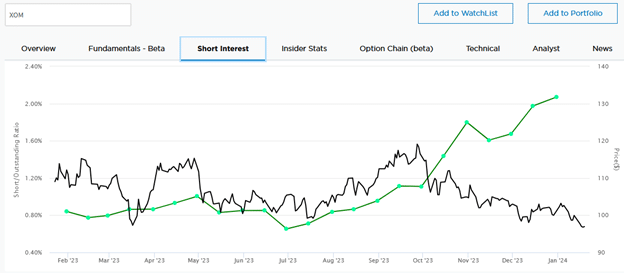
The following graph from SimpleVisor shows that short interest in XOM has risen steadily since July and more rapidly since October. While short traders pressured the stock price lower, the ultimate reversal of their trades will provide a bid for XOM.
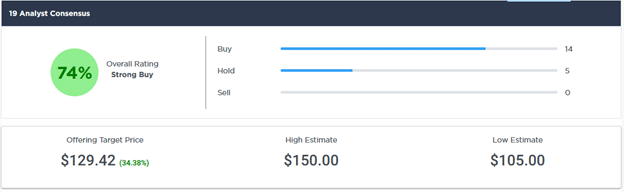
Lastly, of the 19 Wall Street analysts covering XOM, 14 have a buy rating, and the other 5 have hold ratings. The average target price is 129.42, 35% higher than the current price. The lowest estimate is 105, about 10% above the current price.
Disclosure
This report is not a recommendation to buy or sell the named securities. We intend to elicit ideas about stocks meeting specific criteria and investment themes. Please read our disclosures carefully and do your own research before investing.


Michael Lebowitz, CFA is an Investment Analyst and Portfolio Manager for RIA Advisors. specializing in macroeconomic research, valuations, asset allocation, and risk management. RIA Contributing Editor and Research Director. CFA is an Investment Analyst and Portfolio Manager; Co-founder of 720 Global Research.
Follow Michael on Twitter or go to 720global.com for more research and analysis.
Customer Relationship Summary (Form CRS)