


The HOPE analysis we presented in Monday’s Commentary addressed the typical progression of economic data leading to recessions. The H in HOPE stands for housing. Housing is often the first segment of the economy to feel the weight of higher interest rates. The Commentary shows a graph of plummeting homebuilder confidence. Such is not surprising given 6%-7% mortgage rates.
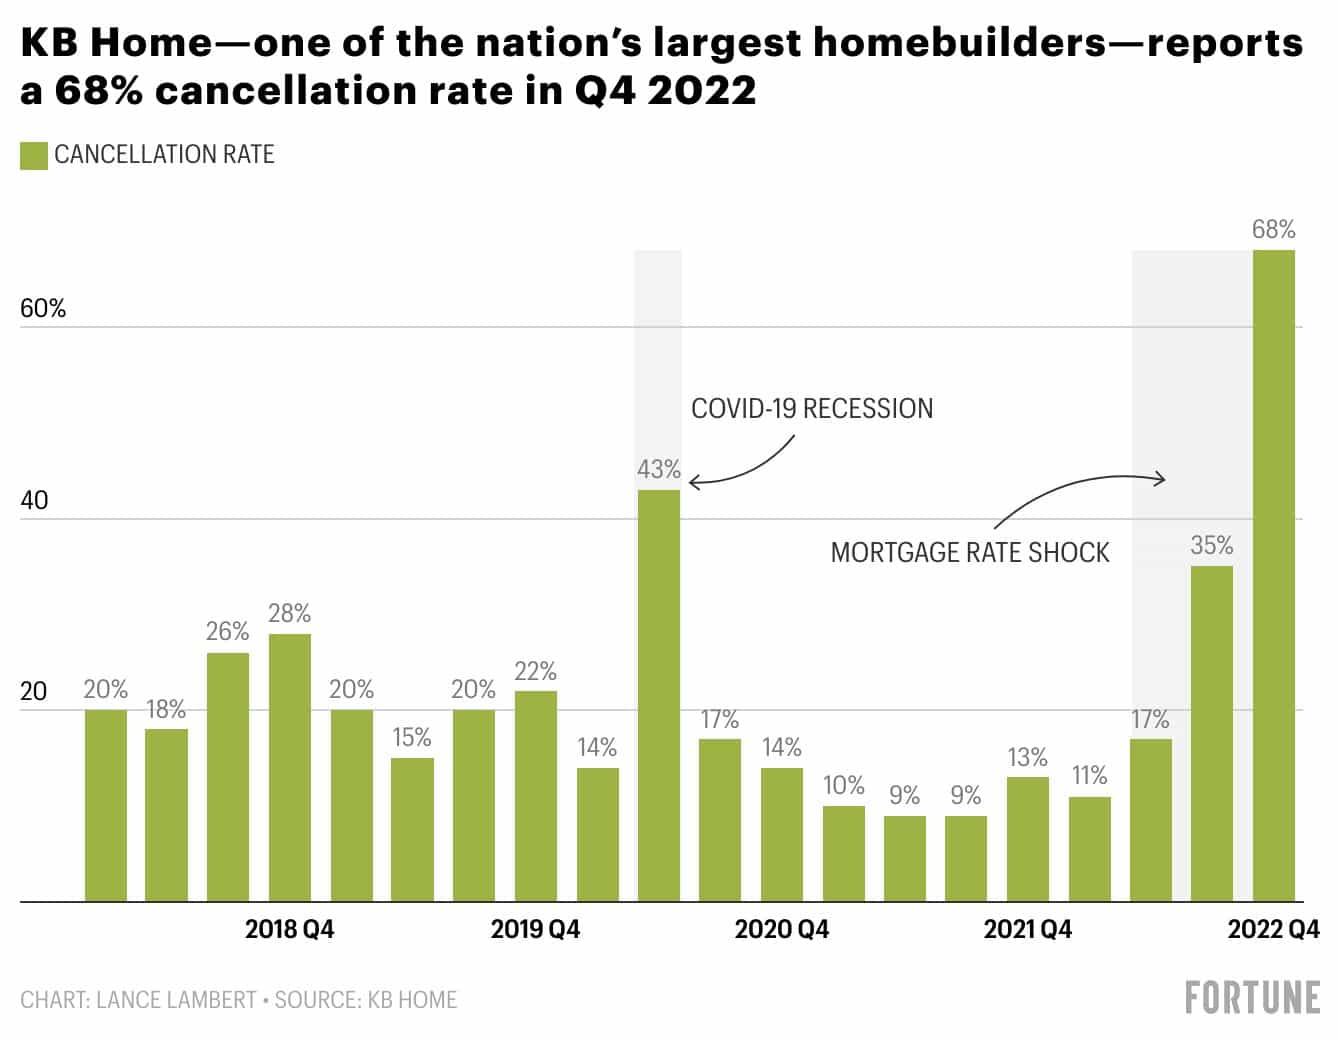
As a result of higher mortgage rates, homebuilders are reporting a massive number of cancellations. Homebuyers who previously agreed to purchase a new home are backing out in record numbers. The graph below from homebuilder KB Homes shows that in the fourth quarter, a cancellation rate of over two-thirds of the contracts they signed. Such is higher than in the first quarter of 2020 when the covid shock first hit. Further, it exceeded the highest industry average cancellation rate of 45% in 2008. Despite higher mortgage rates and cancellations, homebuilder stocks are hanging in there. Over the last six months, the homebuilder ETF XHB has risen 12% and it is in line with the S&P 500 over the last year. Homebuilder stock investors are pricing in a pivot. What if they are wrong?
What To Watch Today
Economy
- 8:30 a.m. ET: Import Price Index, month-over-month, December (-0.9% expected, -0.6% prior)
- 8:30 a.m. ET: Import Price Index excluding petroleum, month-over-month, December (-0.3% expected, -0.3% prior)
- 8:30 a.m. ET: Import Price Index, year-over-year, December (2.2% expected, 2.7% prior)
- 8:30 a.m. ET: Export Price Index, month-over-month, December (-0.7% expected, -0.3% prior)
- 8:30 a.m. ET: Export Price Index, year-over-year, December (7.3% expected, 6.3% prior)
- 10:00 a.m. ET: University of Michigan Sentiment, January Preliminary (60.7 expected, 59.7 prior)
Earnings
Market Trading Update
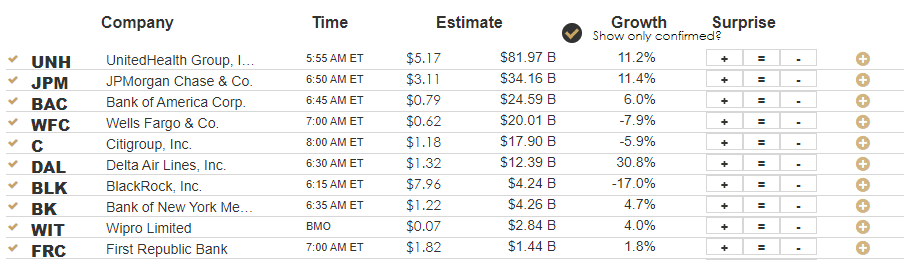
As we will discuss next, CPI can in exactly on estimates, which is rare. However, it was the perfect number, not too hot or too cold. With that, the market did manage another day of gains pushing up into key resistance at the 200-DMA. Today, earnings season gets underway with key reports from the banking sector along with Delta Airlines (DAL) and United HealthCare (UNH). Next week, the deluge of reports will begin, and we will look closely at CEO statements on forward guidance.
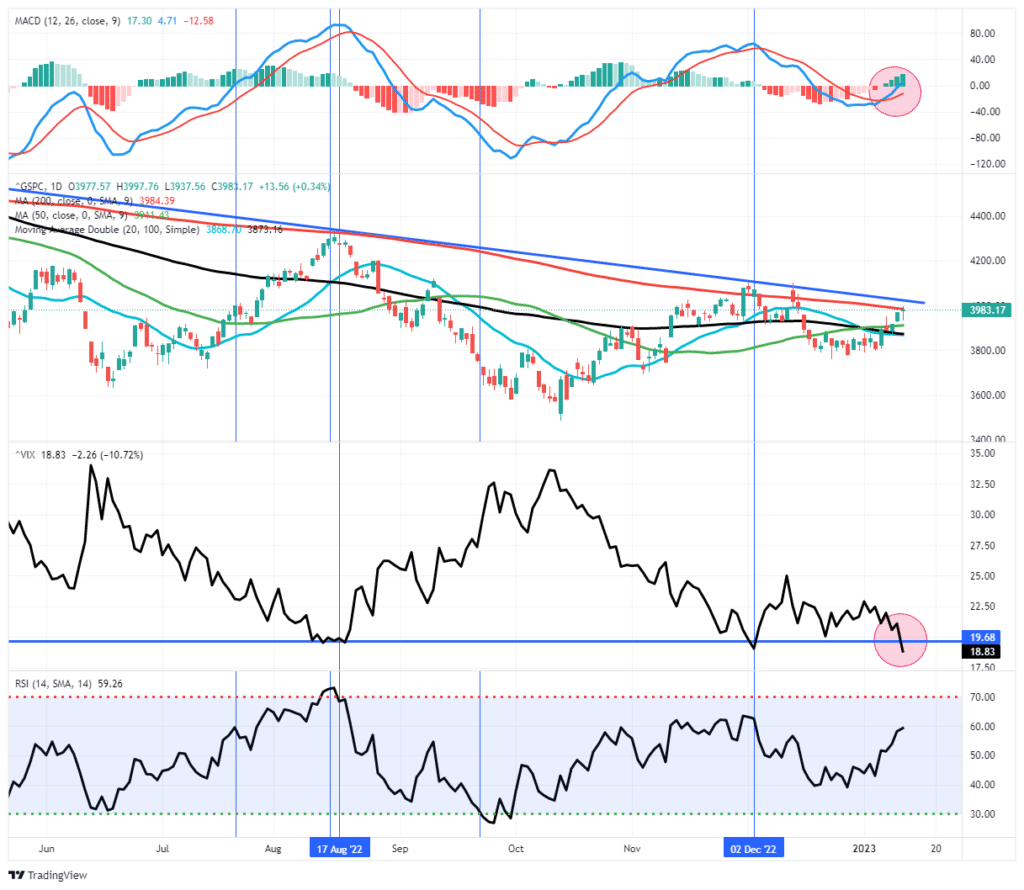
As we will discuss in this weekend’s newsletter (subscribe for free email delivery), the market is in the process of developing a more bullish basing pattern. The market has recently established a higher low and potentially formed a “right shoulder” of an “inverse head-and-shoulders” technical pattern.
“An inverse head and shoulders, also called a “head and shoulders bottom”, is similar to the standard head and shoulders pattern, but inverted: with the head and shoulders top used to predict reversals in downtrends.
This pattern is identified when the price action of a security meets the following characteristics: the price falls to a trough and then rises; the price falls below the former trough and then rises again; finally, the price falls again but not as far as the second trough. Once the final trough is made, the price heads upward, toward the resistance found near the top of the previous troughs.” – Investopedia

With the MACD buy signal intact, if the market can rally above the downtrend resistance and the 200-DMA, there is not much resistance beyond that. From a bearish view, the volatility index fell below 20, which, over the last year, has signaled short-term market peaks. The showdown between the bulls and bears will start today, and we will know who won by the end of next week.
CPI- A Tale of Two Inflations
CPI came in exactly as the market expected. Monthly CPI fell by 0.1%, bringing down the year-over-year rate to 6.5%. The monthly core rate rose by .3%. CPI, excluding shelter inflation, was down .5% monthly.
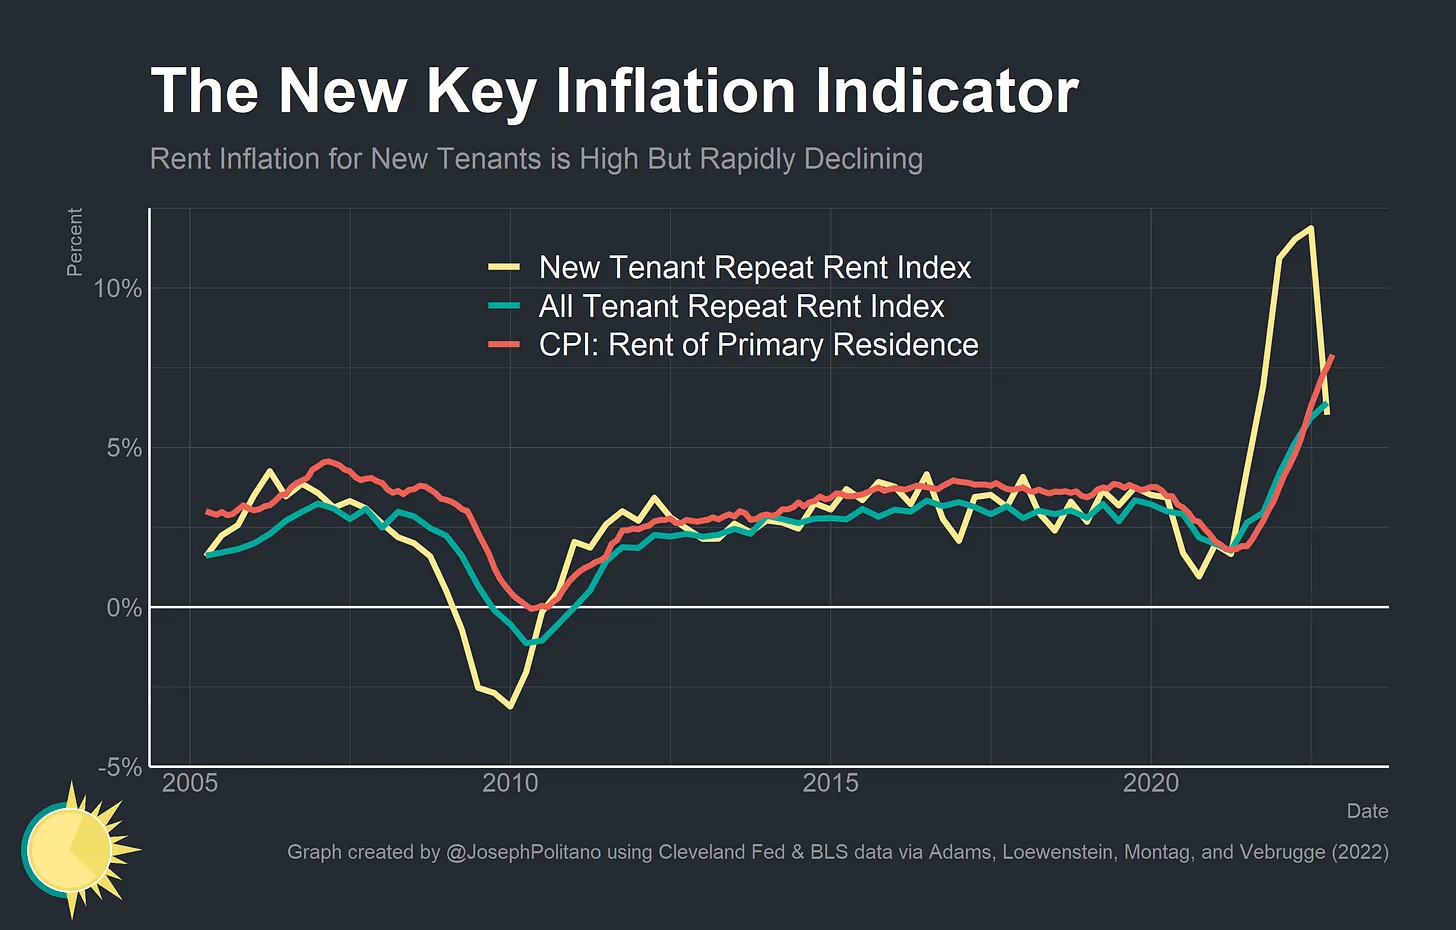
Shelter prices, primarily based on rents and imputed rent accounts for about a third of CPI. Shelter CPI rose 7.5% year over year, the highest rate of housing inflation since 1982. CPI shelter is a lagging indicator. It significantly understated housing inflation over the last couple of years and is now overstating it. Likely CPI will fall more rapidly once CPI shelter prices catch up with real rental prices.
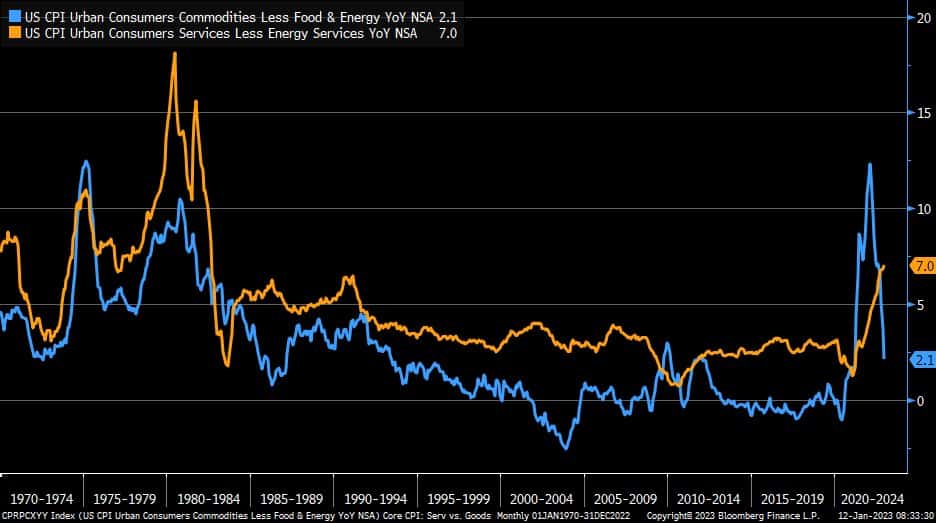
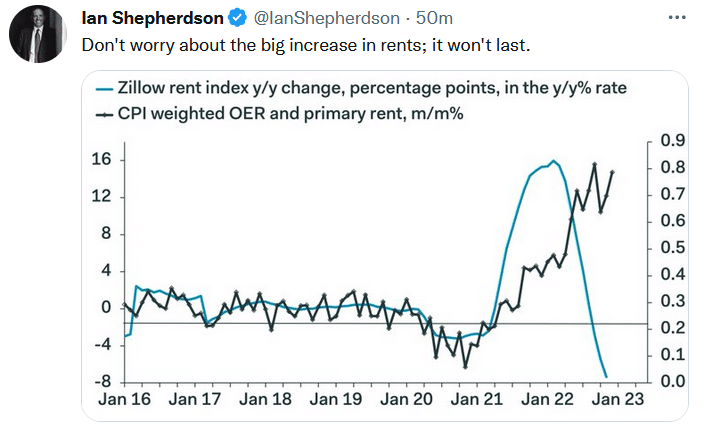
The graph below shows the tug of war within the inflation data. Core goods CPI, predominately commodities, are seeing rapid disinflation (blue), yet at the same time, core services (orange), which include shelter prices, are still moving higher. The second graph shows how CPI shelter lags more timely new and existing renter indexes.
Winning the War on Inflation
The New York Times recently interviewed Fed Member Neel Kashkari to elaborate on what it may take to win the war against inflation. Kashkari readily acknowledges that a recession with higher unemployment may be the cost of success. As we wrote in Lower Stock Prices Are the Fed’s Goal, the Fed may likely want stock prices to fall further to help tighten financial conditions, thus lowering inflation. Per the article:
We believe they want lower trending stock prices with controlled volatility until they meet their goals. Hawkish rhetoric, higher interest rates for longer, and QT can help them on their quest.
Within the New York Times article linked above was a paragraph that is worth repeating.
I commented that the financial markets didn’t seem to believe that the Fed would stay the course. The central bank, in its latest forecast, had projected that the Fed Funds Rate would increase to at least 5 percent and that there would be no rate cuts this year. But the markets were pricing in cuts starting in its second half. “I’ve spent enough time around Wall Street to know that they are culturally, institutionally, optimistic,” Kashkari replied. I said it seemed almost as if the markets were playing chicken with the Fed. Kashkari laughed. “They are going to lose the game of chicken, I can tell you that,” he said.
Simply Neel warns investors not to fight the Fed. He believes the Fed will keep rates higher for longer and market expectations for a summer pivot are misplaced.

Treasuries Get More Attractive as CPI Fall
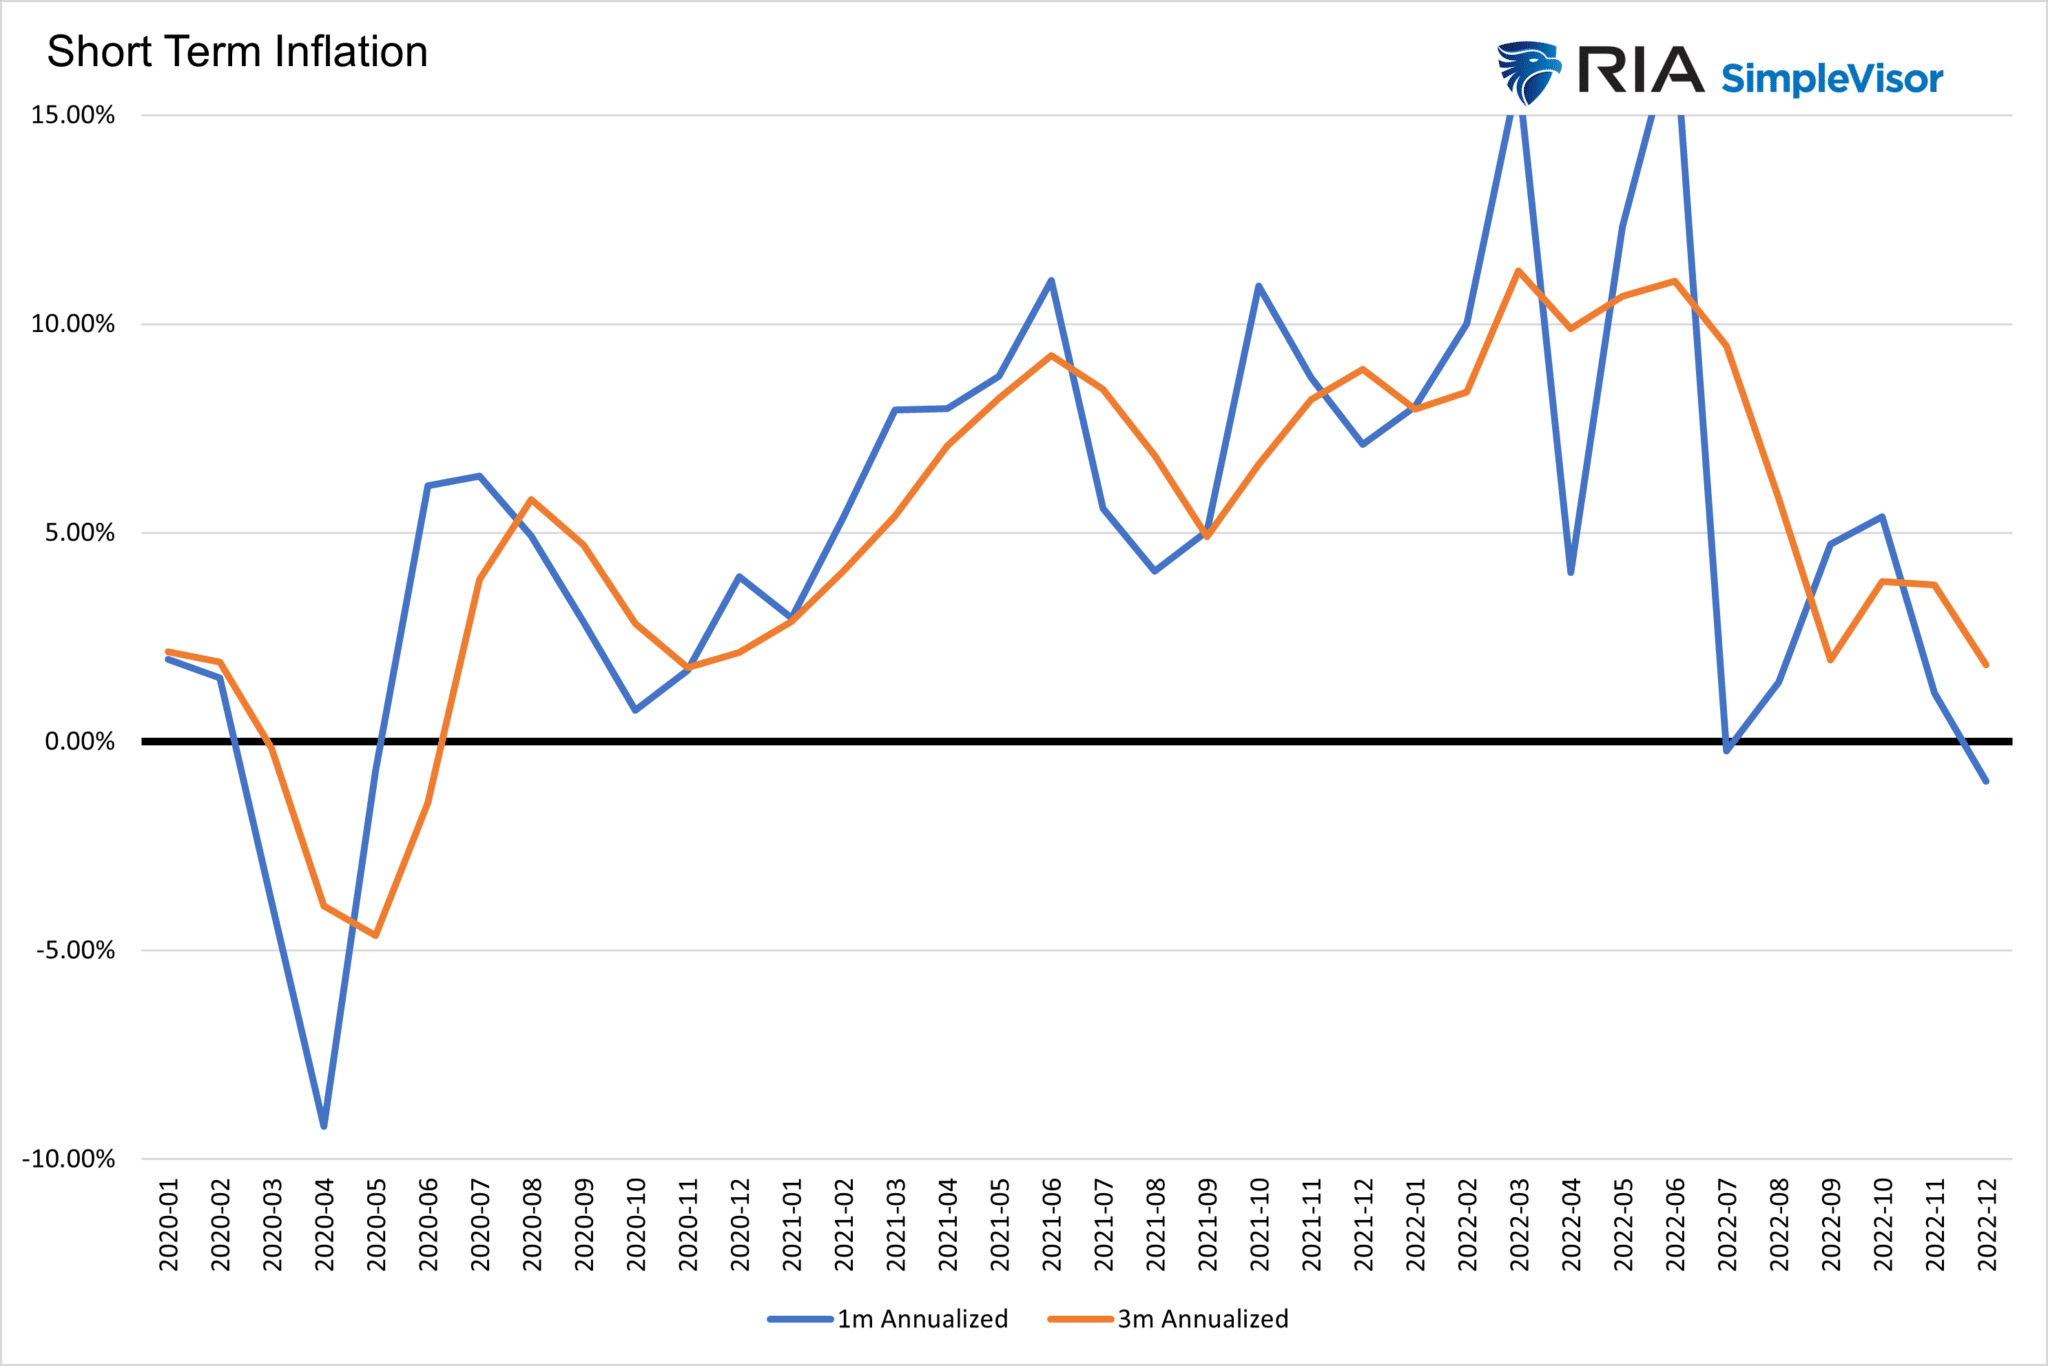
The media focuses on the annual inflation rate, which is now 6.5%. While a helpful inflation indicator, it can be a little misleading as it relies on monthly inflation rates from nearly a year ago. To better indicate recent inflation trends, we can annualize the latest monthly or last three months of data, as shown in the chart below. The current annualized one-month CPI is -.95%, and the three-month rate is +1.83%. Both show that current inflation rates are below the Fed’s 2% target.
Now consider that the 10-yr UST bond yield is 3.55%, which is 1.72% above the three-month annualized rate. From 2015 through 2019, the average spread was .50%. One can easily argue that bond yields will decline rapidly if inflation continues at recent rates.
Tweet of the Day
Please subscribe to the daily commentary to receive these updates every morning before the opening bell.
If you found this blog useful, please send it to someone else, share it on social media, or contact us to set up a meeting.