


By Lance Roberts | April 15, 2023

Inside This Week’s Bull Bear Report
- Market Volatility Returns
- Inflation Eases. Is The Fed Next?
- How We Are Trading It
- Research Report – Recession Odds Jump
- Youtube – Before The Bell
- Stock Of The Week
- Daily Commentary Bits
- Market Statistics
- Stock Screens
- Portfolio Trades This Week
Market Volatility Returns
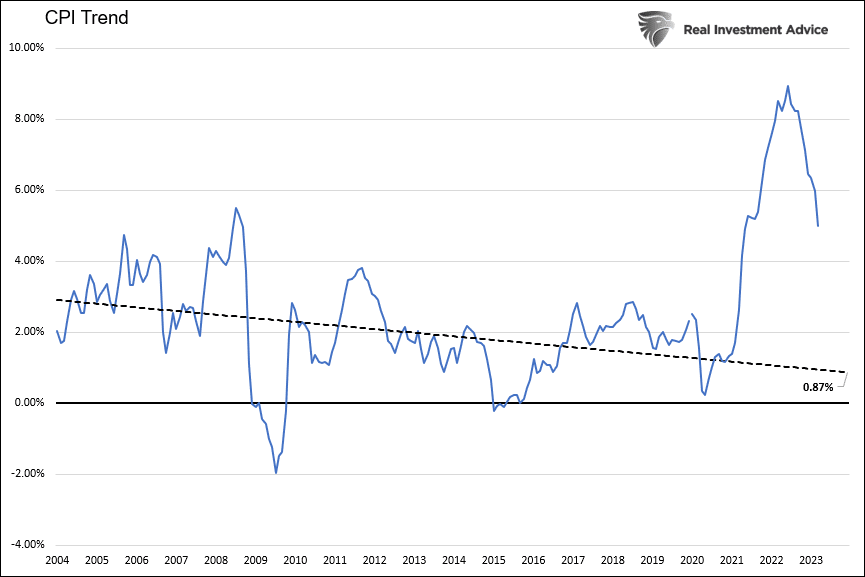
“Inflation eases” was the headline that consumed the media over the last few days. As discussed in more detail, while inflation eased, did it decline enough to halt the Fed’s rate-hiking campaign? Michael Lebowitz noted on Friday that CPI remains well above the long-term trend.
More on this momentarily.
From a market perspective, not much changed. As noted last week:
“I would not be surprised to see more weakness next week, particularly given Friday’s employment report, which showed a slowing in the pace of hiring and suggests economic weakness is becoming more widespread.”
We saw this at the beginning of the week, but the market managed a rally on Thursday following a decline in the Producer Price Index, confirming that inflation eased in March. However, on Friday, disappointing retail sales sent the market lower. If you like volatile trading, this past week had plenty.
Nonetheless, after another retest of the downtrend line on Wednesday, the huge market rally on Thursday confirmed that bullish breakout by rising above the previous highs. The bull market is officially back, with the 50-DMA now well above the 200-DMA and BOTH moving averages trending higher. Notably, the MACD buy signals remain intact, which suggests that investors maintain increased equity exposures.
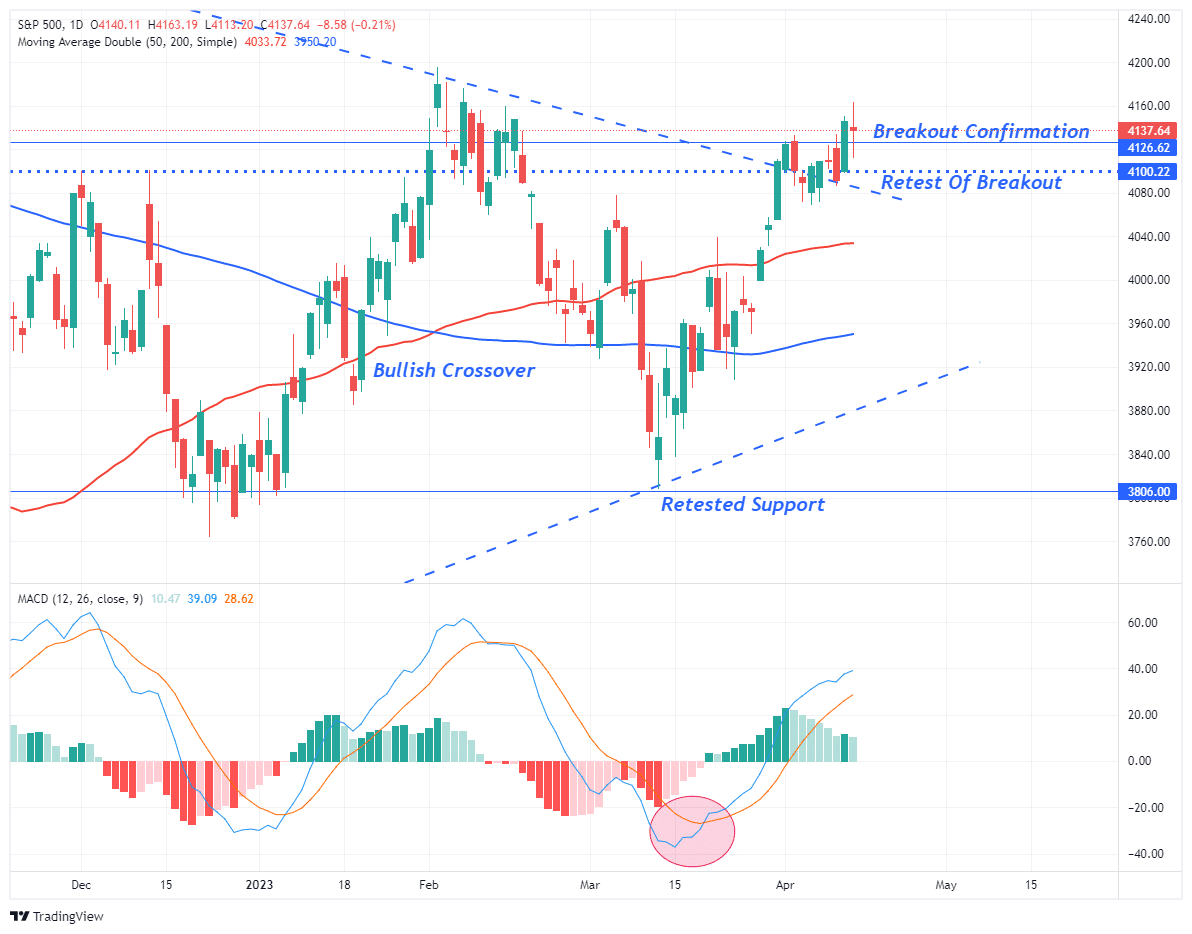
Even with all of the bullish signals confirming a move higher in the market is likely, such does NOT mean there won’t be 5 to 10% corrections along the way that can be used to increase equity exposure. Given the tug-of-war between market expectations and economic realities, I expect a continued increase in market volatility in the coming months. But, overall, the market action remains decidedly more bullish than bearish, and we must trade it as such.
Of course, the big question following this week’s CPI release is now that inflation eased to 5% annually, will the Fed finally follow suit and stop hiking interest rates?
Need Help With Your Investing Strategy?
Are you looking for complete financial, insurance, and estate planning? Need a risk-managed portfolio management strategy to grow and protect your savings? Whatever your needs are, we are here to help.

Inflation Eases. Is The Fed Next?
On Wednesday, the latest Consumer Price Index (CPI) reading was released, showing a modest increase of 0.1% at the headline. The market initially took that news as positive as it continues to suggest that inflation eased towards the Fed’s target of 2%. The hope is that a weaker inflation print would incentivize the Federal Reserve to “pause” its most aggressive rate hiking campaign since the 1970s.
While the market initially rallied, those gains were soon reversed as the realization of the “core” inflation rate remained “sticky,” coming in at a 0.4% monthly rate. As shown, headline inflation eased sharply since its peak last year. As we stated numerous times, such should be the expectation as year-over-year comparisons ease and the excess money supply fades from the system. However, the more critical “core” reading remains elevated and not far off its previous peak.
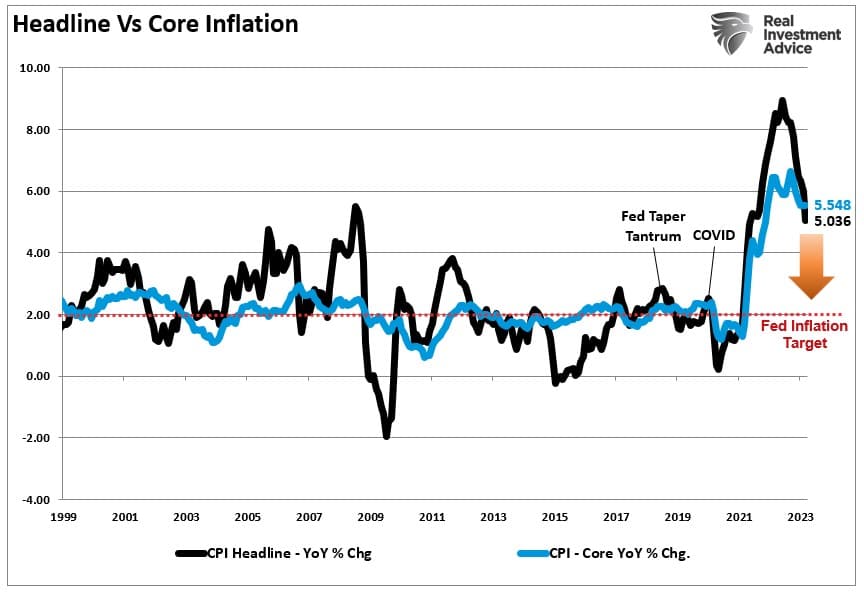
More importantly, the “sticky price” index remains elevated and not far off its peak. Such also suggests that the Fed may not be as close to a “pause” as the equity markets have hoped.

It is reasonable to understand why the markets have focused on the headline inflation measure as a guide for monetary policy. The Fed funds rate tends to follow inflationary trends with a lag. Therefore, it is unsurprising the markets are betting on Fed rate cuts due to the decline in headline inflation. However, given that the current inflation rate is the highest since the 1980s, the Fed may be reticent about cutting too soon.

Given that the Fed focuses more on the core inflation rate than the headline, such suggests the Fed will need to hike rates by at least 0.25% at the upcoming FOMC meeting.
“There is a need for more monetary policy tightening to reduce persistently high inflation.” – Fed Govenor Chris Waller
With employment remaining elevated, oil prices back on the rise, and mortgage demand ticking up due to lower yields, there is a risk of a resurgence of inflation in the months ahead.
The Federal Reserve may view the data as a warning that it is too soon to “pause.”
But then there is the risk of a recession.
Lots Of Recession Indicators, No Recession
Instead, I should say no recession yet.
Over the last several months, we have repeatedly discussed the numerous recessionary indicators that previously preceded recessionary outcomes. From inverted yield curse, the manufacturing, to leading economic indicators. However, the financial markets remain bullishly biased despite these “flashing warning” signs.
For instance, the 10-year Treasury bond versus the 3-month Treasury bill is the most inverted since the early 1980s. There has never been such an inversion occurring without a recession following. (Note: the recession occurs FOLLOWING the UN-inversion of the yield curve.)

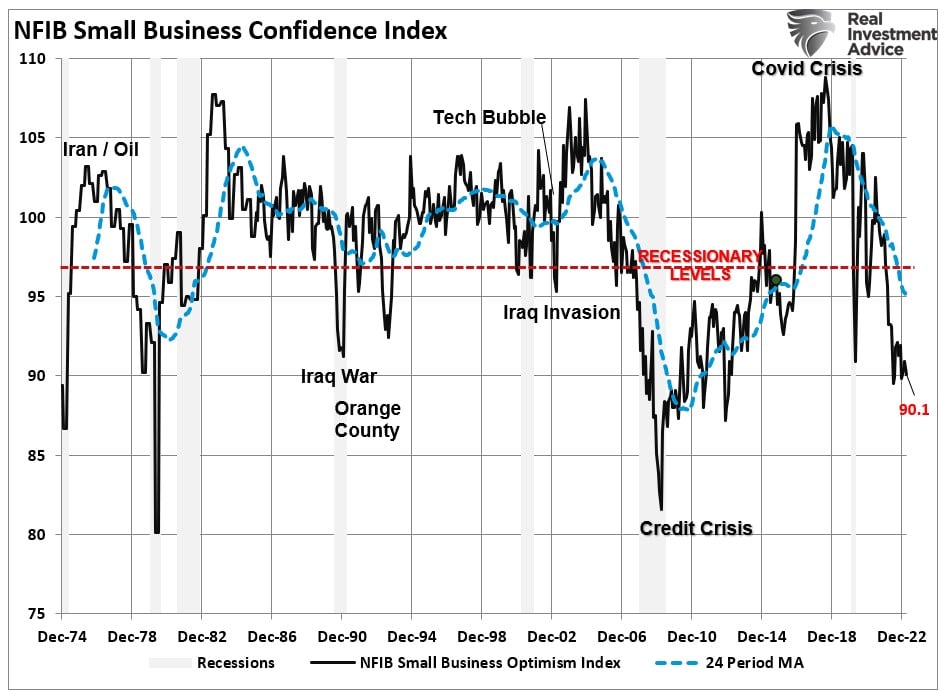
But yield curves are not the only warning of a slower economic environment. Small business sentiment has also dropped to levels that correlate highly to recessionary onsets. Small businesses comprise roughly 50% of all employment in the country and are the most impacted by changes to consumptive behaviors. The latest NFIB survey sent clear warnings that activity is economic activity is slowing quickly.
Furthermore, when small businesses are concerned about economic sustainability, they become more cautious about capital expenditures. Historically, real gross private investment declined sharply whenever CapEx plans were cut. Those declines typically precede an economic recession as the spending contraction also leads to employment reductions.

While the market continues to rally on hopes of “easier monetary policy” from the Federal Reserve and a “no recession” scenario, we suggest such may be overly optimistic. It is pretty likely the lag effect of monetary policy is still working its way through the system, and we are likely to see rising levels of unemployment in the months ahead.
Unprecedented
Even in the latest FOMC minutes, the Fed noted the risk of a recession.
“The staff’s projection at the time of the March meeting included a mild recession starting later this year, with a recovery over the subsequent two years.”
It is crucial to understand that the Federal Reserve has never previously verbalized the word “recession” in its speeches. Even before the 2008 financial and the 2000 “dot.com” crisis, the Fed regularly discussed a “soft landing” or “Goldilocks” economy. If the Federal Reserve says, “Get prepared, a recession is coming,” its words would cause actions within the economy that would advance, and potentially worsen, that outcome.
Therefore, the Fed must always be cautious in making statements to the financial markets, as its words cause actions. My concern is that if the Fed’s previous discussions of “soft landings” and “Goldilocks” scenarios resulted in fairly deep recessions, what does a “mild recession” portend?
More importantly, until a recession of any magnitude or further banking stress materializes, we do not expect the Fed to start cutting rates. However, when the Fed does begin to cut rates, it will be due to the recognition that a “recession” is underway. The yield curve will steepen dramatically, lowering yields as inflation eases with slowing economic activity.
From an investment standpoint, we agree with BankAmerica in their latest note:
“Sell the last rate hike. Investors are too optimistic about rate cuts and not pessimistic enough about a recession. ‘Sell the last hike’ was the correct strategy for stocks in inflationary ’70s/’80s, ‘buy the last hike’ worked in the ’90s disinflationary market. Recessions reliably negative for equities throughout history and insufficiently discounted in advance. Plenty of room for more S&P 500 downside,

Earnings Season Underway
As noted in last week’s message, “Millennial Earnings Season” is officially underway with the kickoff of the major banks. JPM was the first up on Friday with a massive beat from a 49% jump in “net interest income,” or rather the difference between the revenue generated from a bank’s interest-bearing assets and the expenses associated with paying on its interest-bearing liabilities.
But as we noted in that article:
“Estimates were lowered substantially going into Q1, so expect a high “beat rate” for companies. While the beating estimates will get headlines, it will be the “forward guidance” driving their prices. CEO confidence remains very low. Therefore, weak guidance could knock some of the exuberance out of the markets.”
Notably, in just two weeks, S&P Global cut estimates again, lowering the bar to just $171.83 per share.
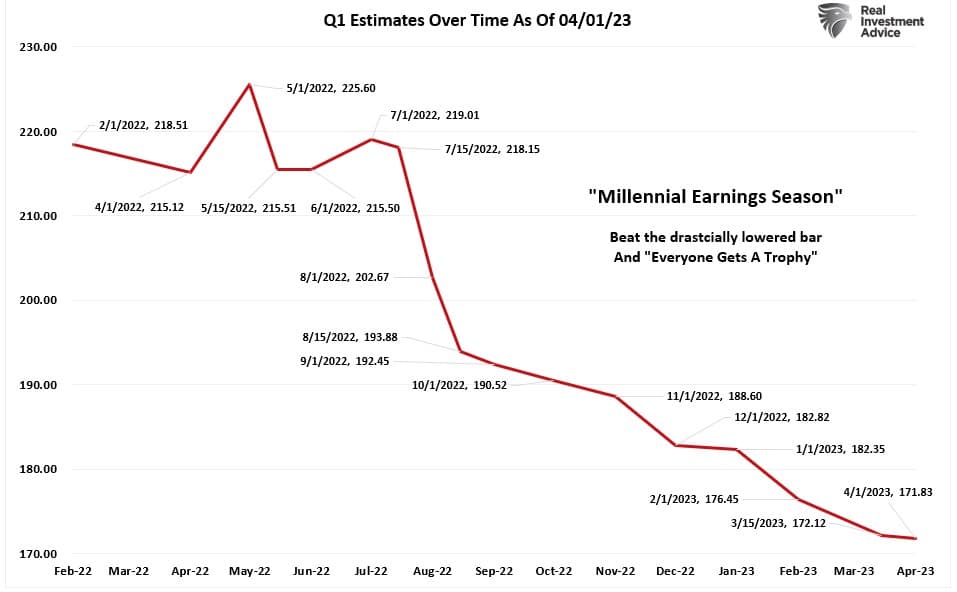
While earning beats will be necessary for the bulls, the corporate guidance will likely move stocks the most. There, investors will assess whether high-profit margins can be sustained due to weaker economic activity and inflation easing (lowering pricing power) as higher wages and input costs erode profitability. Given the significant deviation from the long-term growth trend, expectations for sustainability seem elevated, suggesting a reversion is more likely.
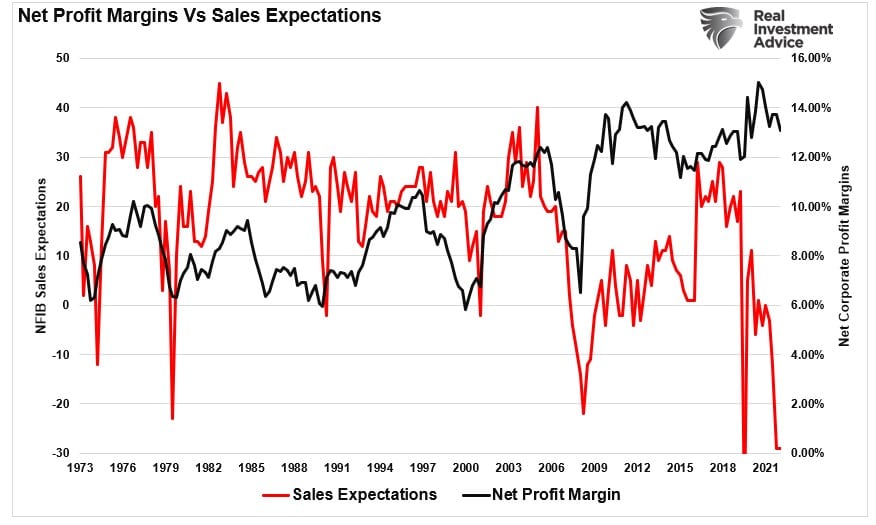
While the markets continue to trade bullishly in hopes of easier monetary policy, the weaker economic growth outlook will question many overly optimistic projections. Such is particularly the case when you see that sales expectations by small businesses have declined sharply, which historically leads to declines in net profits.
Some companies will surpass earnings expectations by a wide margin when they report. Such is always the nature of earnings season, but we need to see a turn by the majority to a more positive outlook to suggest the worst is behind us.
Given the data, that may be a fairly big ask.
How We Are Trading It
As noted, while inflation eased, we expect the Fed not to cut rates until they are forced to by some exogenous, credit, or financial event that impacts financial stability or a recession. Such an event will not be stock friendly and could lead to another market decline of 10%. Such would provide a much stronger entry point for equity risk.
However, the market remains bullishly biased as investors continue chasing higher markets. With the daily and weekly buy signals intact, there is little reason to become overly defensive until those signal change. For now, we continue maintaining exposures to equity risk, although at reduced levels.
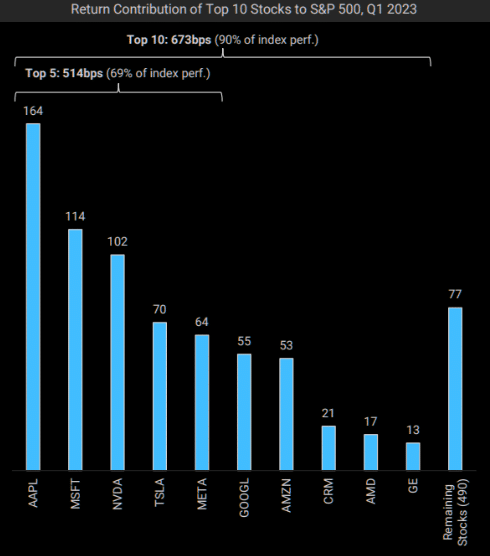
As we enter earnings season, I would expect the bullish bias to persist, and with the market not aggressively overbought, we could see prices continue to rise. My only reservation has been the narrow market breadth, with the top 10 stocks in the index accounting for most of the market’s gains year-to-date.
We rely on technical indicators and monitor short-term risks adjusting allocations accordingly. While we did increase our equity exposure previously, we remain decently underexposed to equities. While we did increase our bond allocations previously, we are looking for opportunities to increase the duration of our holdings further. Given recessionary risks have increased, we adhere to our discipline accordingly to help offset our base emotional reactions.
The current market rally has room to move higher. As such, we are looking for opportunities to rebalance exposures and risks accordingly.
- Tighten up stop-loss levels to current support levels for each position.
- Hedge portfolios against significant market declines.
- Take profits in positions that have been big winners.
- Sell laggards and losers.
- Raise cash and rebalance portfolios to target weightings.
Have a great week.
Research Report
Subscribe To “Before The Bell” For Daily Trading Updates (Formerly 3-Minutes)
We have set up a separate channel JUST for our short daily market updates. Be sure and subscribe to THIS CHANNEL to receive daily notifications before the market opens.
Click Here And Then Click The SUBSCRIBE Button
Subscribe To Our Youtube Channel To Get Notified Of All Our Videos
Stock Of The Week In Review
This week we employ our proprietary Relative and Absolute analysis within SimpleVisor to provide the most oversold stocks.
Our relative analysis model generates a history of the price ratio of each sector to the S&P 500, as well as the sector’s top ten holdings versus the sector ETF itself. It then applies multiple technical studies to the data. It scores them based on the degree to which each technical study is overbought or oversold and how they changed over various periods. Indicators are weighted by importance. The analyses include 20-, 50-, and 200-day moving averages, MACD, RSI, and Williams. The total score is normalized to a range of +1 to -1. We consider a score of +/- .75 strongly overbought or oversold. We have yet to see a perfect score of +/-1.
We combine relative and absolute analysis with helping us find overbought or oversold companies relative to the S&P 500 and its respective sector. SimpleVisor can chart the movement of the two indicators over time. For example, the graph below, combining our relative and absolute scores, shows how the utility and discretionary sectors have trended over the last four weeks. Utilities were deeply oversold on a relative and absolute basis four weeks ago but have since become slightly overbought on both gauges. At the same time, the discretionary sector was near fair value four weeks ago but has since become very oversold on a relative basis and slightly oversold on an absolute basis.
Often the most oversold or most overbought scores revert toward fair value. The overbought/oversold signals are strengthened when our proprietary money flow analysis provides a similar conclusion.
Here is a link to the full SimpleVisor Article For Step-By-Step Screening Instructions.
Login to Simplevisor.com to read the full 5-For-Friday report.
Daily Commentary Tidbits
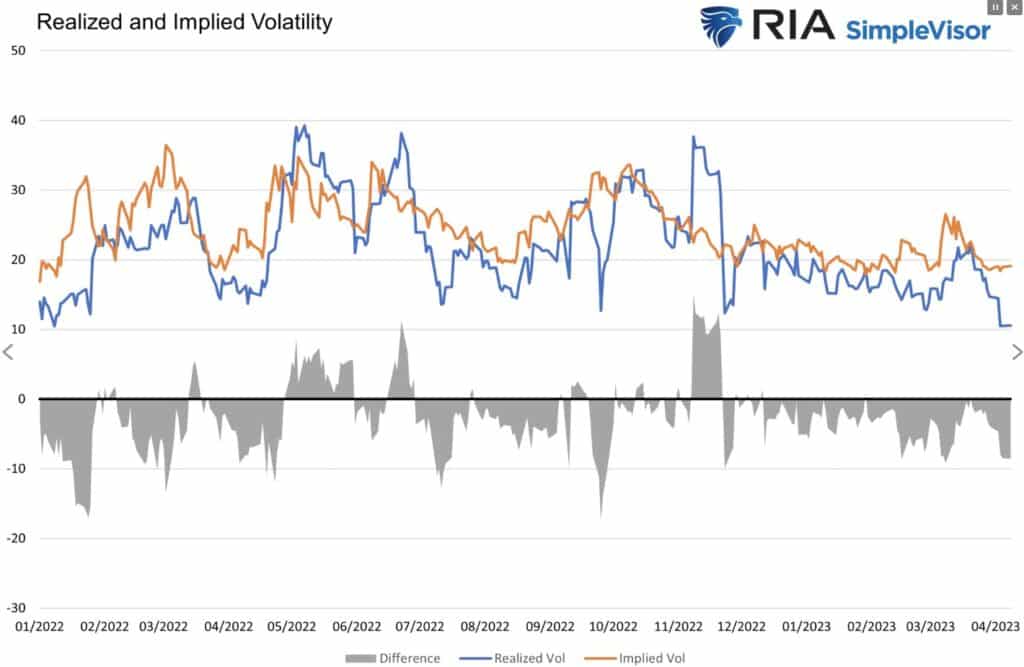
Bond Markets Send Confusing Messages
Volatility in the equity markets has fallen significantly over the last few weeks. The graph below compares two popular measures of equity volatility. Realized volatility is the annualized volatility based on recent actual changes in the S&P 500. Implied volatility, using options pricing, gauges expectations for expected equity volatility. Realized and implied annualized volatility are at or near the lowest levels since the downward trend started. Consider that the average daily price change over the last five days is only .58%. In 2022 the average daily price change was double that at 1.19%.
The critical question is, what does low volatility mean for equity prices going forward? For starters, it means the tug-of-war between buyers and sellers (bulls and bears) has found a happy medium. Such a stable condition can last a while, but new data or news can motivate buyers or sellers and cause volatility to spike from its complacency. Enjoy the stability for now, as volatility will spike again. Such does not necessarily mean stocks will move lower, although volatility is often negatively correlated with equity prices. Given the large divergence between what the market thinks the Fed will do and what the Fed says it will do, heightened volatility is sure to spike again.
(Subscribe To The Daily Market Commentary For A FREE Pre-Market Email)
Bull Bear Report Market Statistics & Screens

SimpleVisor Top & Bottom Performers By Sector

S&P 500 Weekly Tear Sheet
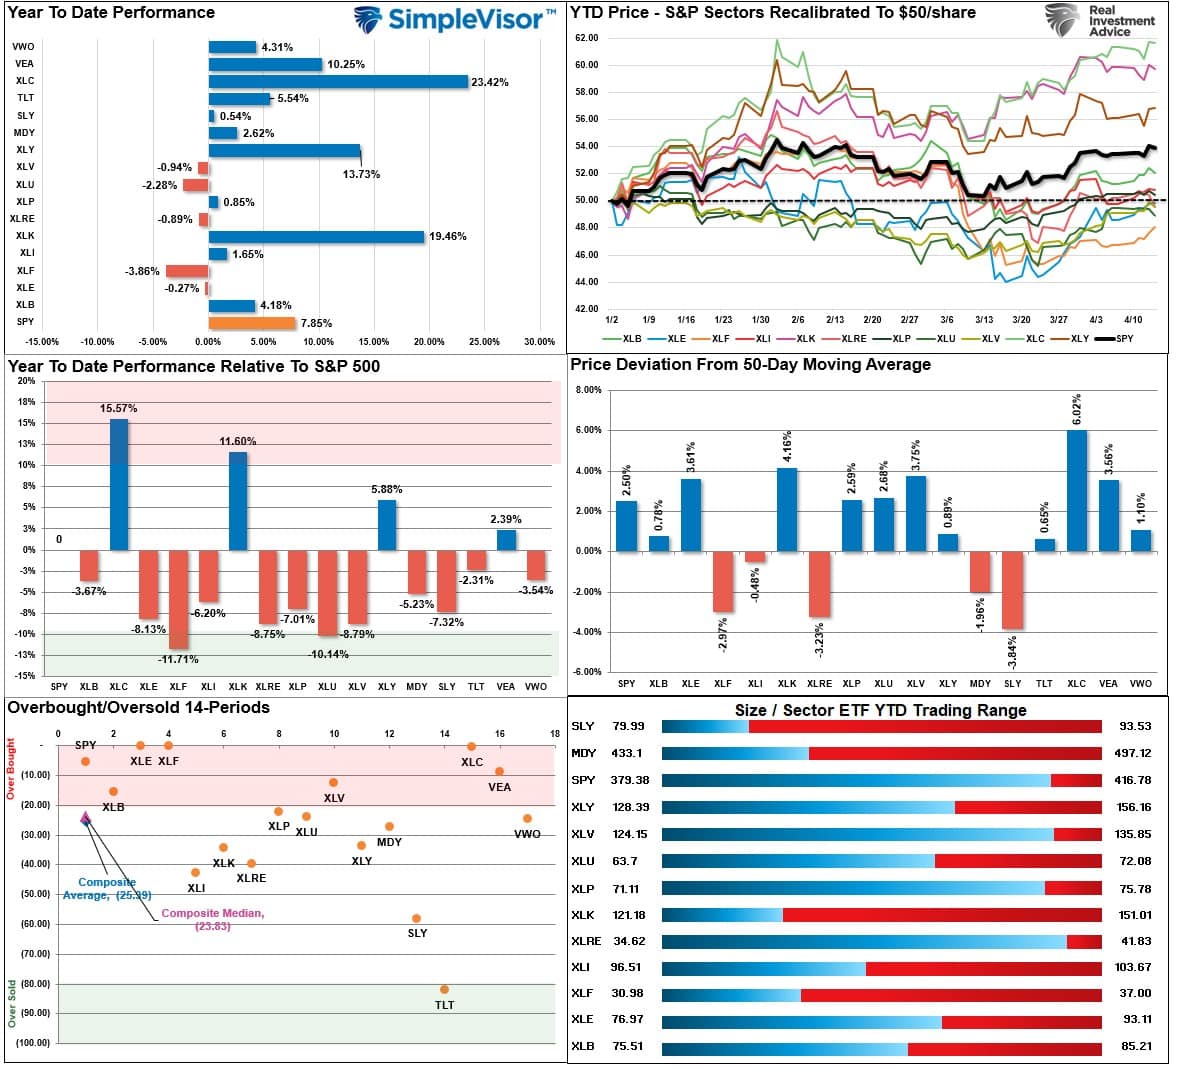
Relative Performance Analysis
As noted last week:
“While the market pulled back some last week, it has not resolved much of the short-term overbought condition. We could see some additional selling pressure next week as a result.”
That was the case mostly last week except for Thursday’s short-covering rally on weaker inflation data. However, although some of the short-term overbought conditions got resolved, much of it has not. Therefore, we could see additional sloppy trading next week as a result. However, Energy, Communications, Financials, and the S&P Index are overbought near term. Bonds are now more attractive for adding to holdings.
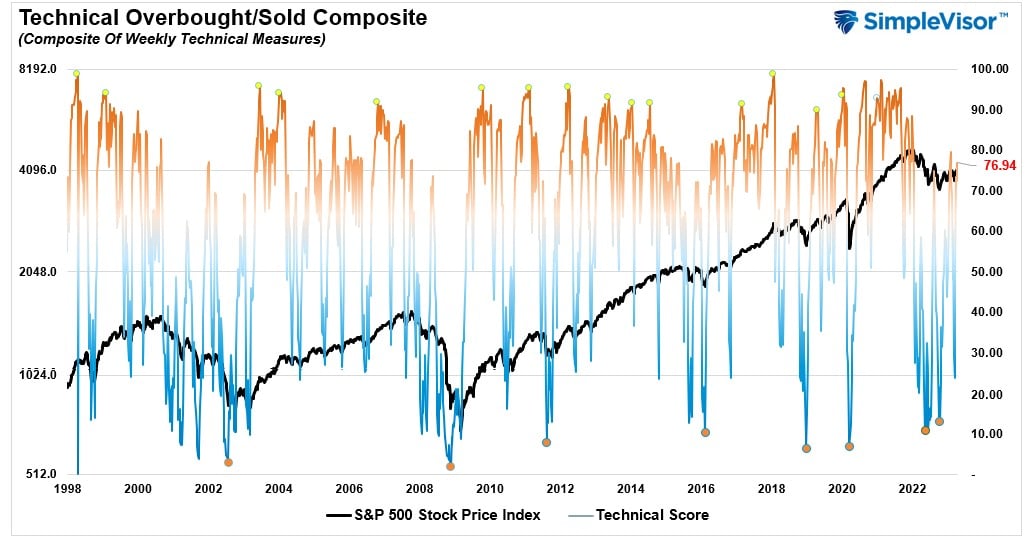
Technical Composite
The technical overbought/sold gauge comprises several price indicators (RSI, Williams %R, etc.), measured using “weekly” closing price data. Readings above “80” are considered overbought, and below “20” are oversold. Markets peak when those readings are 80 or above, suggesting prudent profit-taking and risk management. The best buying opportunities exist when those readings are 20 or below.
The current reading is 76.94 out of a possible 100.
Portfolio Positioning “Fear / Greed” Gauge
The “Fear/Greed” Gauge is how individual and professional investors are “positioning” themselves in the market based on their equity exposure. From a contrarian position, the higher the allocation to equities, the more likely the market is closer to a correction than not. The gauge uses weekly closing data.
NOTE: The Fear/Greed Index measures risk from 0 to 100. It is a rarity that it reaches levels above 90. The current reading is 62.69 out of a possible 100.

Sector Model Analysis & Risk Ranges
How To Read This Table
- The table compares the relative performance of each sector and market to the S&P 500 index.
- “M” XVER” “Moving Average Cross Over) is determined by the short-term weekly moving average crossing positively or negatively with the long-term weekly moving average.
- The risk range is a function of the month-end closing price and the “beta” of the sector or market. (Ranges reset on the 1st of each month)
- The table shows the price deviation above and below the weekly moving averages.
As noted last week, “the rally in “defensive” areas last week, Utilities and Gold Miners, was not surprising as the rotation from Technology and Communications.” Those sectors remain overbought, and last week’s rally pushed Energy and Healthcare above their ranges. With most markets and sectors on bullish moving average crossovers, the most likely path for asset prices is higher over the near term. Maintain equity exposures, but watch for further rotations from grossly overbought areas into oversold.

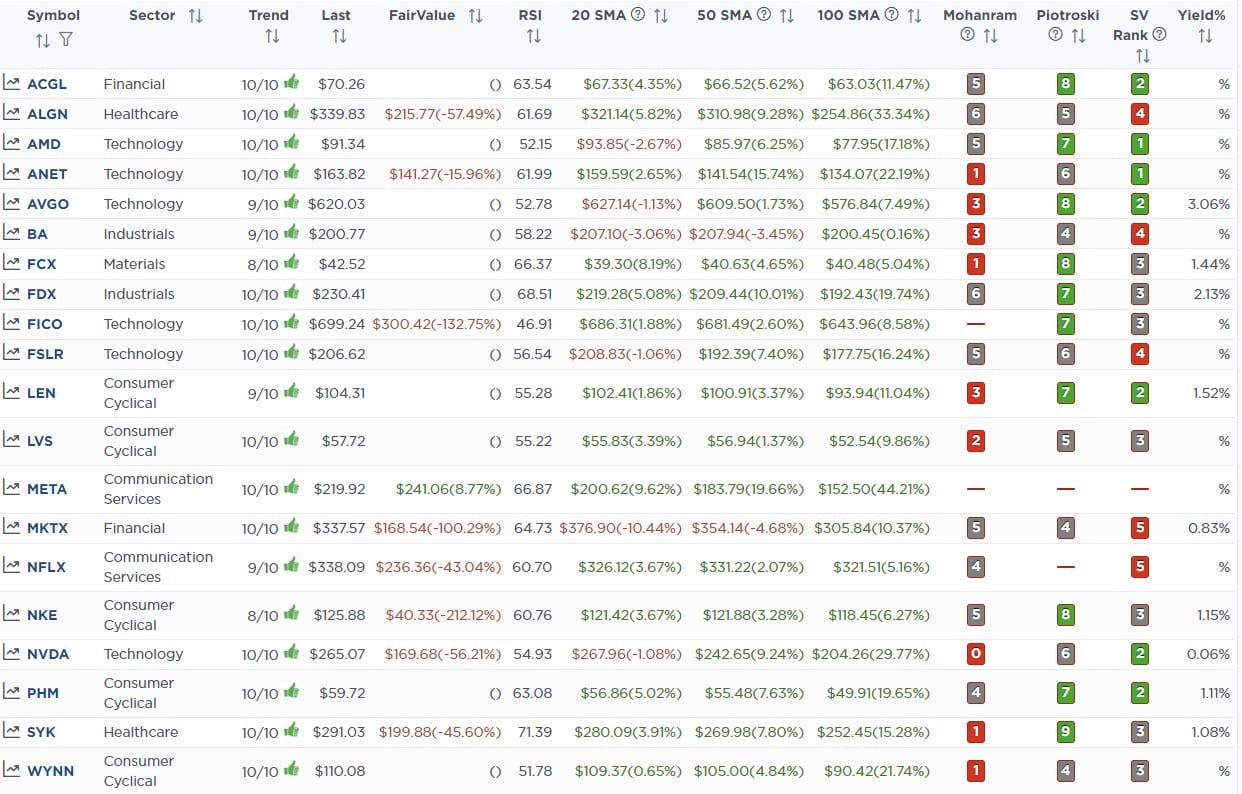
Weekly SimpleVisor Stock Screens
We provide three stock screens each week from SimpleVisor.
This week we are searching for the Top 20:
- Relative Strength Stocks
- Momentum Stocks
- Technically Strong Stocks With Dividends
(Click Images To Enlarge)
RSI Screen
Momentum Screen

Technically Strong With Dividends

SimpleVisor Portfolio Changes
We post all of our portfolio changes as they occur at SimpleVisor:
April 10th
We mentioned in our recent weekly analysis in the newsletter that Technology had become overbought relative to more “defensive” market sectors. As such, we could see a rotation out of technology near term. Such is what we have seen over the last couple of sessions. That weakness is within a few days of reversing the recent “buy signal.”
Given we also own the Equally Weighted S&P Index (RSP) and the S&P Tracking Index (VOO), we are going to sell the Nasdaq Tracking ETF (QQQ) for now and look to use this rotation to add to our individual technology holdings on the pullback.
Both Models
- Sell 100% of the Invesco Nasdaq Trust ETF (QQQ)

Lance Roberts, CIO
Have a great week!


Lance Roberts is a Chief Portfolio Strategist/Economist for RIA Advisors. He is also the host of “The Lance Roberts Podcast” and Chief Editor of the “Real Investment Advice” website and author of “Real Investment Daily” blog and “Real Investment Report“. Follow Lance on Facebook, Twitter, Linked-In and YouTube
Customer Relationship Summary (Form CRS)