


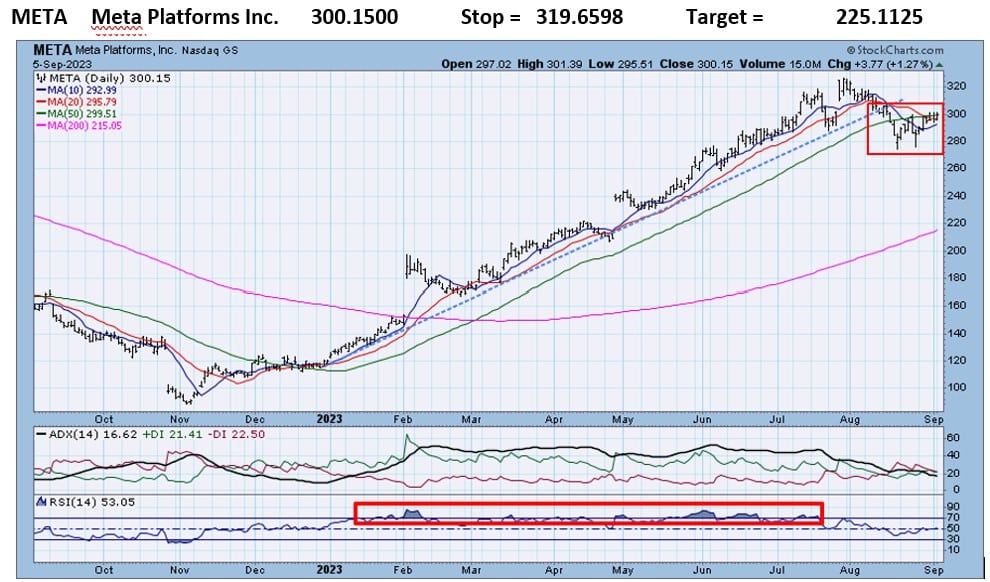
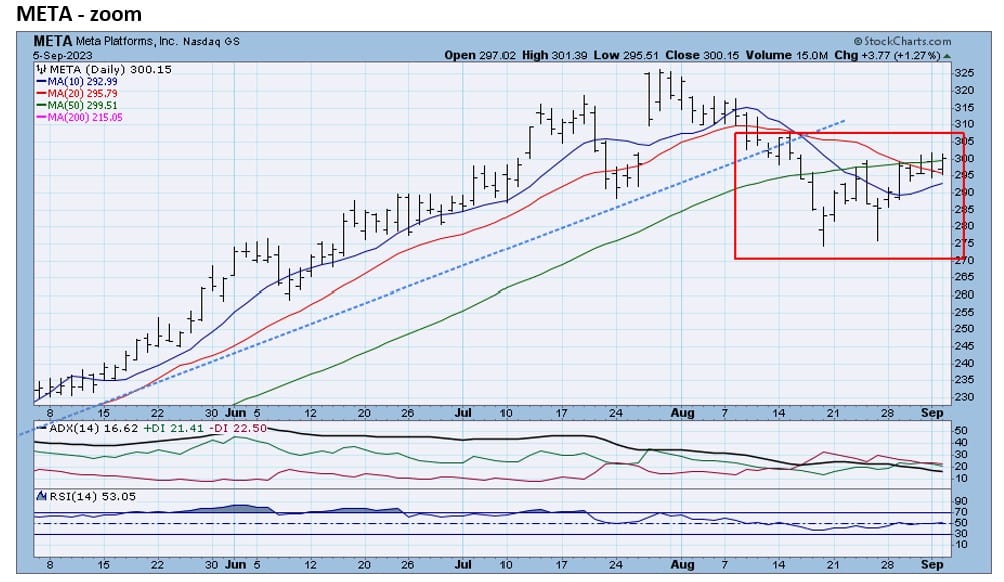
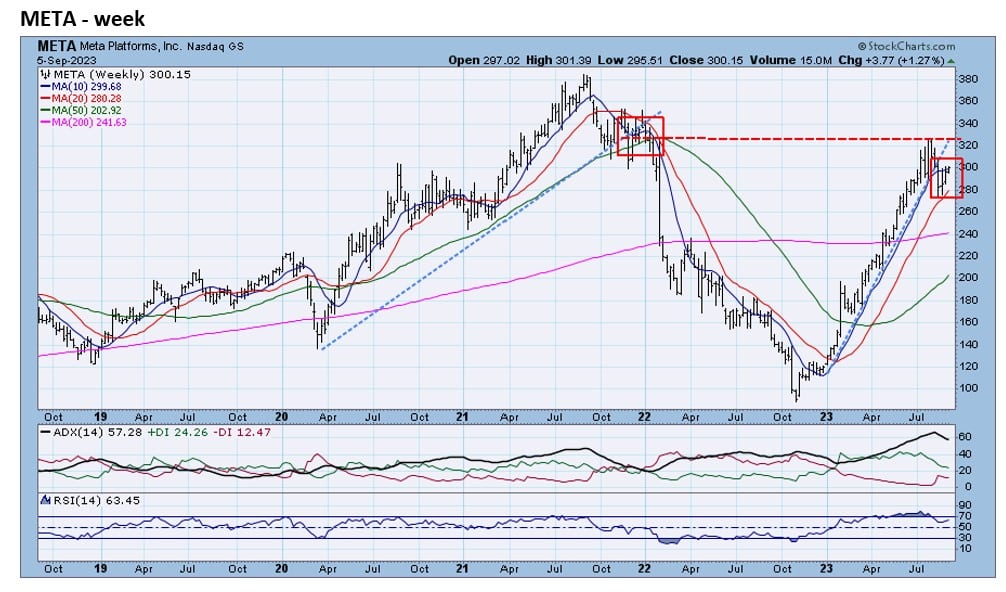
- META fell below its formerly extremely consistent 2023 uptrend line last month. META had climbed an amazing 236% from the November 2022 lows to the late July 2023 highs. META remained overbought, on an RSI basis, for most of 2023. The zoom chart reveals the breakdown in sharp relief. The weekly chart shows that META failed to overcome resistance from the late 2021 breakdown. META is vulnerable to the lower extreme of the 2022 gap (around 225).
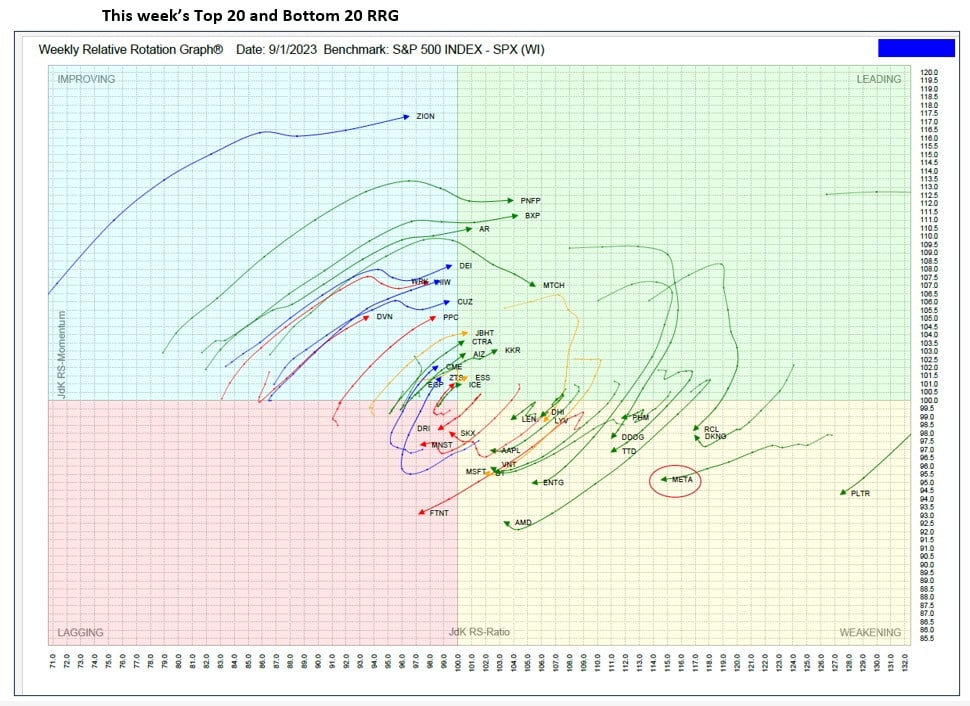
RRG analysis shows that META is now in the Weakening quadrant and is quickly moving toward the Lagging quadrant. META was a bottom 20 stock in this week’s TPA-RRG report. (RRG below)
Relative Rotation Graphs (RRG) – explanation video


Jeff Marcus founded Turning Point Analytics (TPA) in 2009 after 25 years on trading desks and 13 years as a head trader to provide strategic and technical research to institutional clients. Turning Point Analytics (TPA) provides a unique strategy that works as an overlay to clients’ good fundamental analysis. After 10 years of serving only large institutions, TPA now offers its research services to mid and small managers, RIA’s, and wealthy sophisticated individuals looking for a way to increase their returns and outperform their peers.
Subscribe 2 Week Trial
Customer Relationship Summary (Form CRS)