


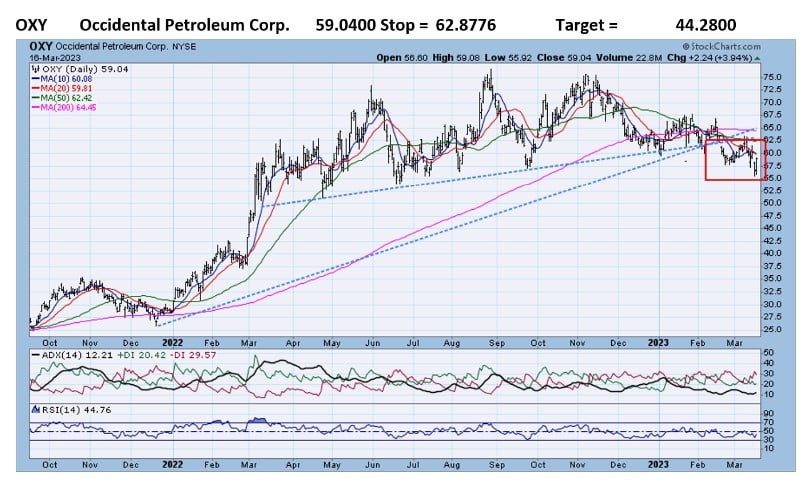
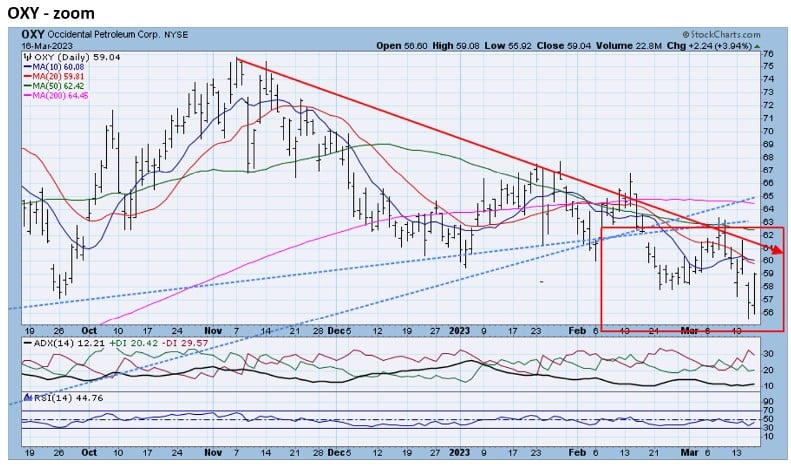
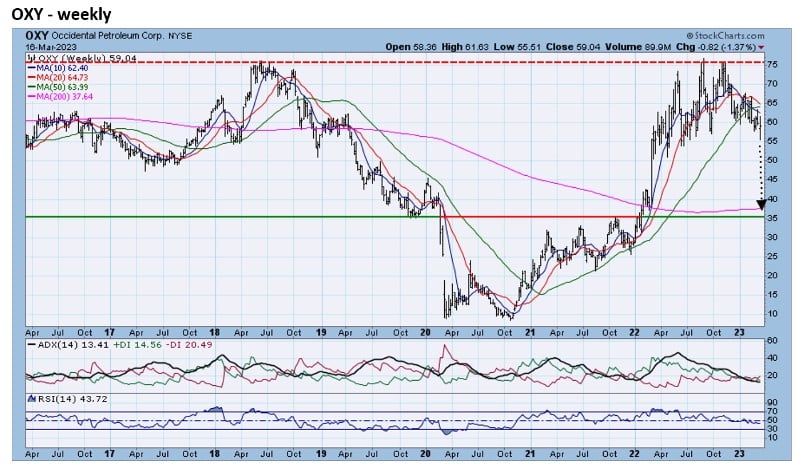
- OXY fell below its 2022 and 10-month uptrend lines in February. The zoom chart reveals a pattern of lower highs, which has formed a 4-month downtrend line. The next long-term support level is back to the 2022 break level or about 35 (weekly chart).
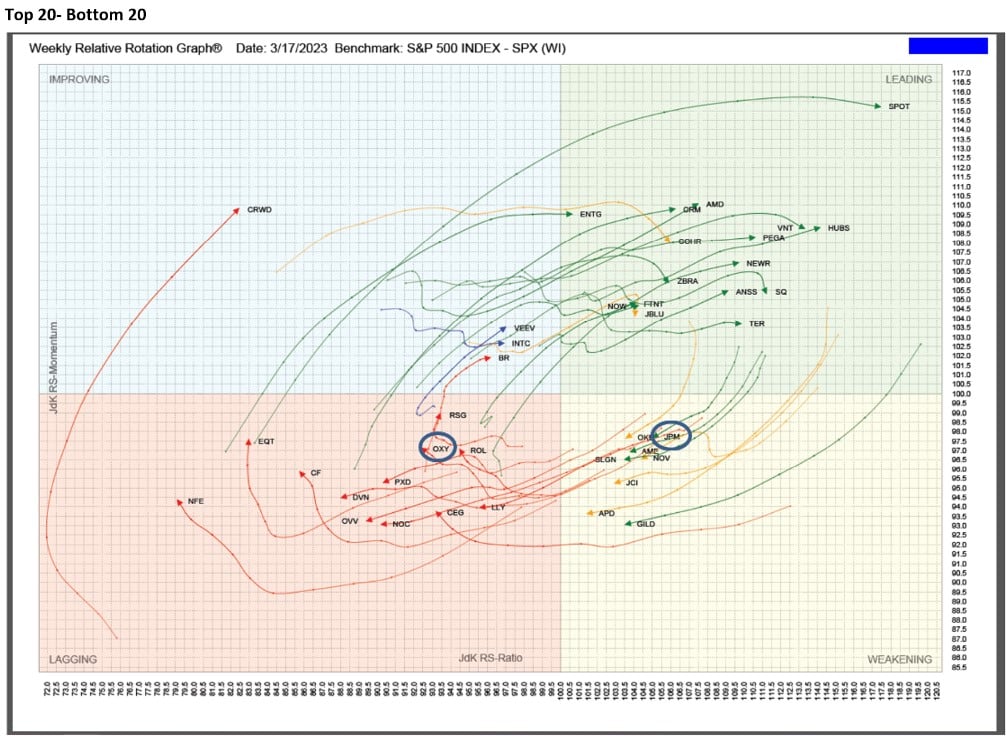
RRG analysis shows that OXY has moved into the Lagging quadrant. OXY was one of the Bottom 20 in this week’s TPA-RRG report. (RRG below).
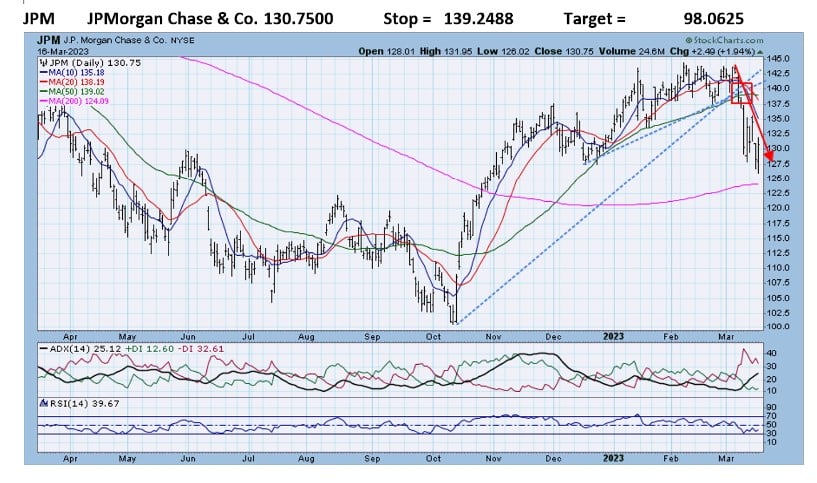
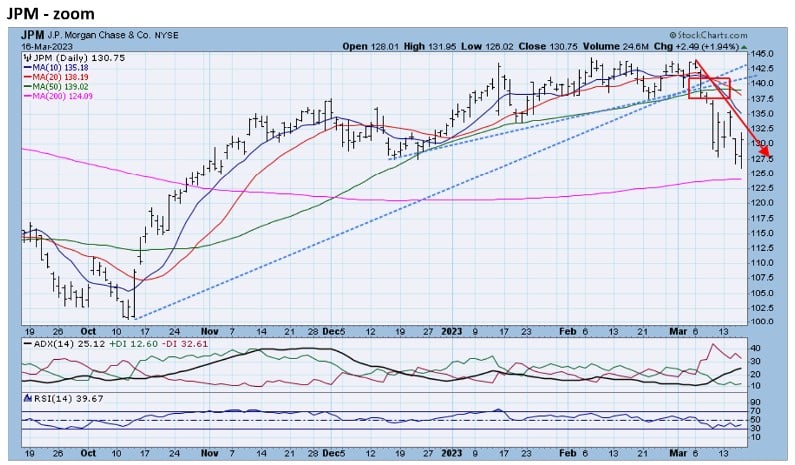
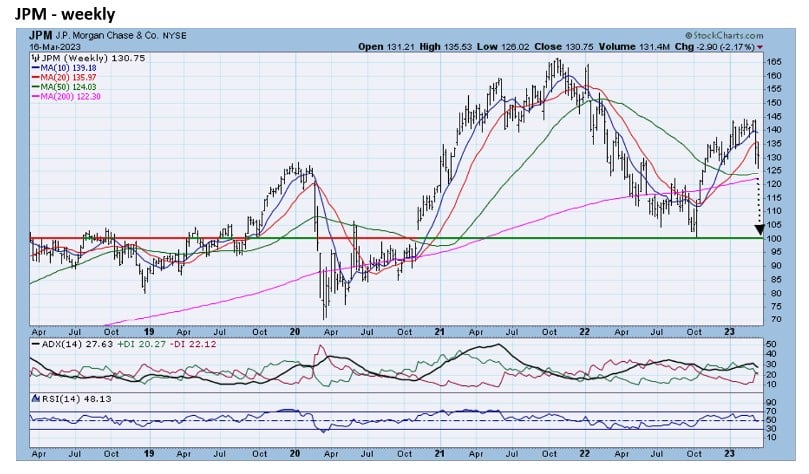
- JPM fell below its 5-month uptrend line after a healthy 4-month 43% rally. JPM also fell below its 2023 uptrend line. The zoom chart shows that JPM has quickly established a downtrend. The weekly reveals that long-term support is 25% lower at the 2020 break-out level.
RRG analysis shows that JPM has moved out of the Leading quadrant and into the Weakening quadrant. JPM should continue this trajectory into the Lagging quadrant. JPM was one of the Bottom 20 in this week’s TPA-RRG report. (RRG below).
Relative Rotation Graphs (RRG) – explanation video


Jeff Marcus founded Turning Point Analytics (TPA) in 2009 after 25 years on trading desks and 13 years as a head trader to provide strategic and technical research to institutional clients. Turning Point Analytics (TPA) provides a unique strategy that works as an overlay to clients’ good fundamental analysis. After 10 years of serving only large institutions, TPA now offers its research services to mid and small managers, RIA’s, and wealthy sophisticated individuals looking for a way to increase their returns and outperform their peers.
Subscribe 2 Week Trial
Customer Relationship Summary (Form CRS)