


Inside This Week’s Bull Bear Report
- Financial Stability Rocked By Defaults
- The Fed’s Tough Choice
- How We Are Trading It
- Research Report – Consensus View Of “No Recession.” Could It Be Wrong?
- Youtube – Before The Bell
- Stock Of The Week
- Daily Commentary Bits
- Market Statistics
- Stock Screens
- Portfolio Trades This Week
Financial Stability Rocked By Bank Solvency
This week financial stability was rocked by bank solvency issues starting with Silicon Valley Bank and spreading through Credit Suisse.
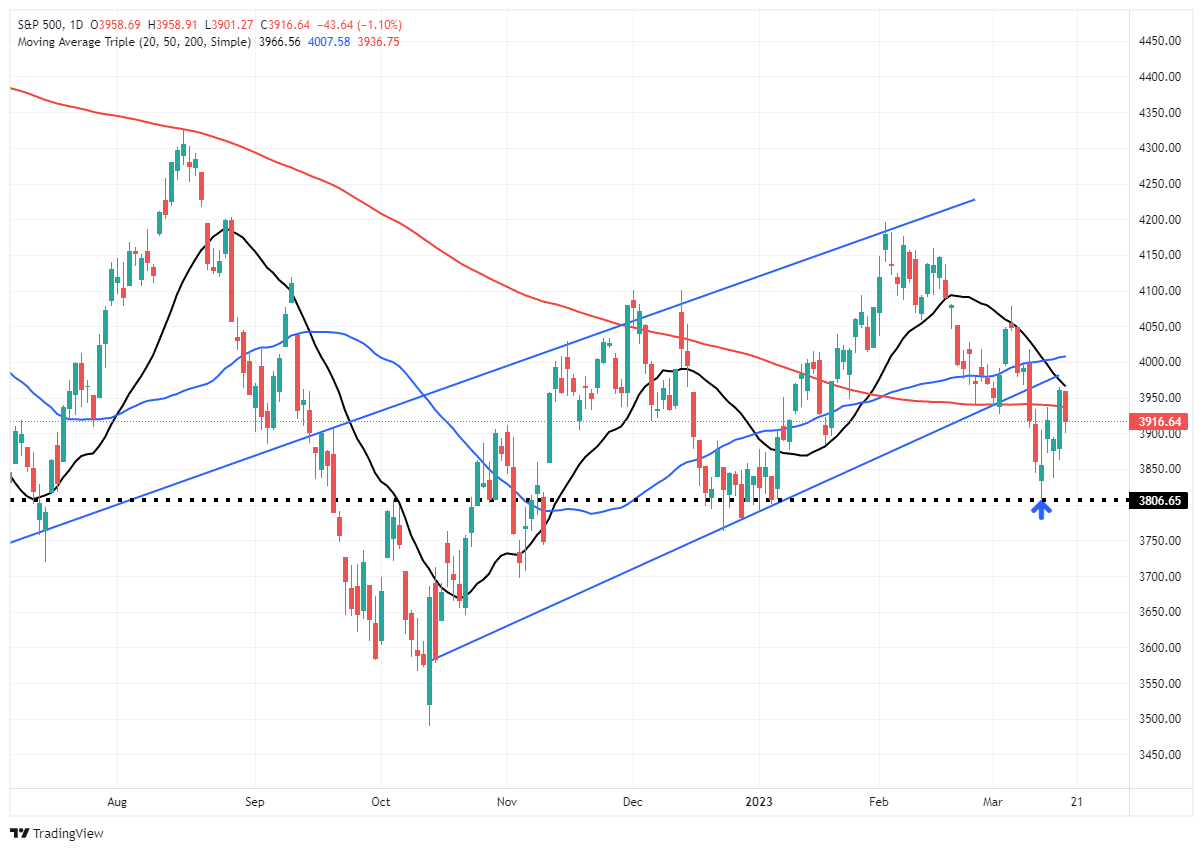
With that, the market took out the support at the rising trend line and the 200-DMA, which violated our stop-loss levels, where we reduced exposure to equities. With all of the previous bullish support levels broken, the next logical level of support is the December lows. A failure there will then set supports at the June and October lows.
The failed retest of the 200-DMA to close the week is not a good look. However, with markets fairly oversold, an attempt early next week before the Fed meeting to retake the previous support won’t be a surprise. Hopes of a “pivot” due to financial stress could contribute to some buying pressure. However, any rally will be limited due to the 20- and 50-DMA just above Thursday’s rally peak.
One important point I discussed in Before The Bell is the importance of perspective.
Take A Step Back
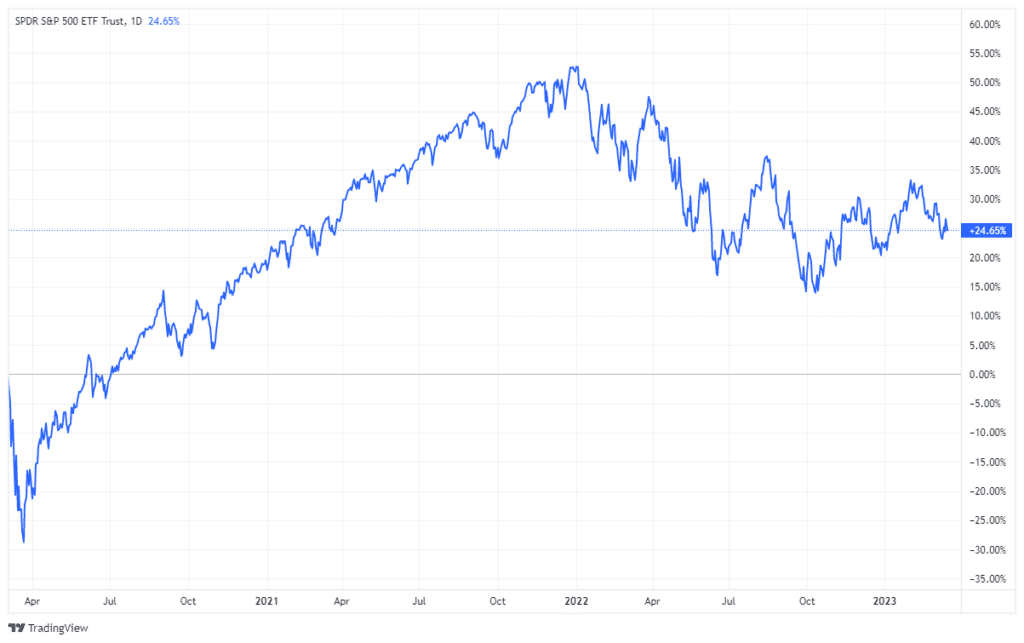
While there are many headlines of “doom, gloom, and disaster,” a step back from the noise reveals a much different picture. As investors, one of the mistakes we make is viewing our portfolios on a year-to-date basis.
Wall Street designed this terrible practice to keep you upset so you will move money around the markets. Money in motion creates fees for Wall Street and generally losses for you.
Yes, the market has been challenging over the last 15 months. However, for most, we have been invested in the markets for longer. Therefore, step back and look at your portfolio over the last 3- or 4-years. Once you do that, a much different picture emerges, as shown. For example, if we look at the period from the March 2020 peak to the present, we find our portfolios are still higher by 24%. That roughly equates to an 8% annualized return which is exactly what would expect from the market.
With 24/7 media looking for anything to make a headline out of, not to mention a bunch of commentators looking for clicks and views, try and focus on what matters to your investment goals.
Removing some of the emotions from our investment strategies can help us reach our long-term goals.
Let’s talk about the Fed’s tough choice next week.
Need Help With Your Investing Strategy?
Are you looking for complete financial, insurance, and estate planning? Need a risk-managed portfolio management strategy to grow and protect your savings? Whatever your needs are, we are here to help.

The Fed’s Very Tough Choice
This coming week the Fed will meet for its 2nd FOMC meeting of 2023. As noted in last week’s newsletter, following Powell’s Senate Banking Committee testimony, odds for a 0.50% rate hike had spiked sharply. To wit:
“Powell made two critical statements that sent stocks tumbling on Tuesday.
‘If the totality of the data were to indicate that faster tightening is warranted, we would be prepared to increase the pace of rate hikes.The latest economic data have come in stronger than expected, suggesting that the ultimate interest rate level is likely to be higher than anticipated.’
That statement sent the odds of a 0.50% increase at the March meeting to nearly 70%. Just a month ago, those odds were ZERO.
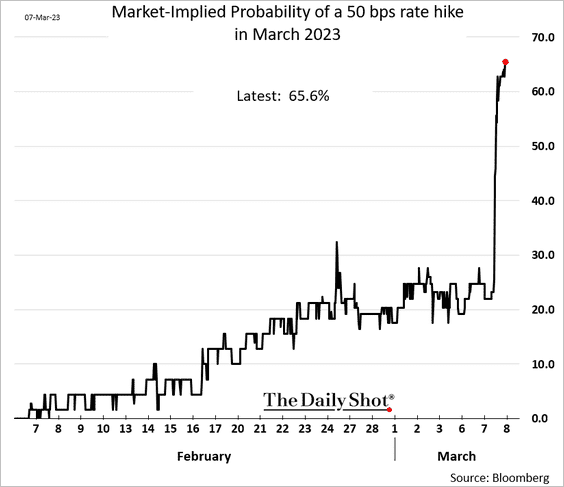
Of course, just a week later, the odds of that 0.50% rate hike crashed back to zero with some uncertainty of even a 0.25% hike.
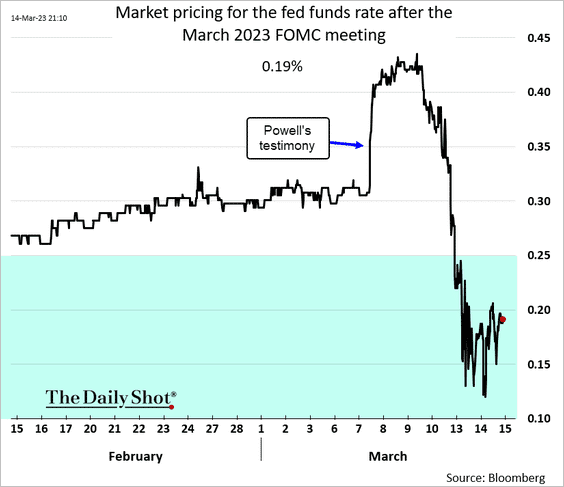
This change in sentiment is unsurprising as the sudden “crack” in “financial stability” rocked the markets last week. As we discussed on Tuesday in “Bank Runs:”
“Reserve banking is not problematic as long as everyone remains calm. As I noted in the ‘Stability Instability Paradox:’
The ‘stability/instability paradox’ assumes that all players are rational and such rationality implies an avoidance of complete destruction. In other words, all players will act rationally, and no one will push ‘the big red button.‘“
In this case, the “big red button” was a “bank run” which crushed Silicon Valley Bank and exposed financial risks in First Republic Bank and Credit Suisse, among others. One way to visualize this risk is the change in the 2-year Treasury Yield.
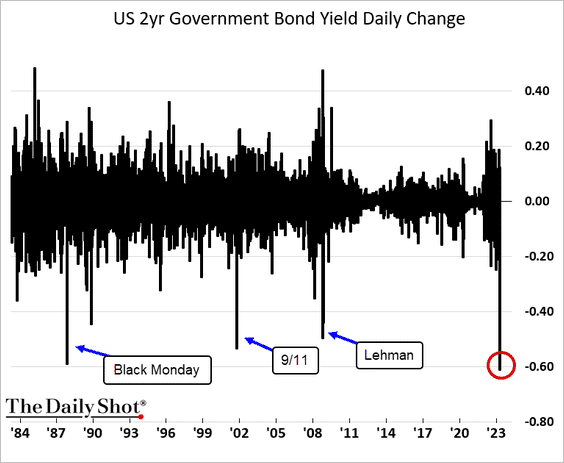
During a crisis, money flows into “risk-free” assets as investors seek safety. That “risk off” trade is reflected by the sharp drop in Treasury bond yields. The magnitude of the drop this past week was only previously seen during the “financial crisis,” the September 2001 terrorist attack, and the 1987 market crash.
With financial instability rising, the Fed faces the tough choice between a “rock and a hard place.”
Fed Meets Rock
Recession odds have climbed considerably since Jerome Powell’s testimony before Congress and the latest FOMC meeting. However, the recent failure of Silicon Valley Bank (SVB), as higher rates impact regional bank liquidity, also added to the risks.
This isn’t the first time we have warned the aggressive rate hiking campaign would either cause a recession or “break something.”
You get the idea. We have been warning of the risk for quite some time. However, the financial markets continued to ignore the warnings.
The Fed remains abundantly clear that it still sees inflation as a “persistent and pernicious” economic threat that must be defeated. This is the Fed’s “rock.”
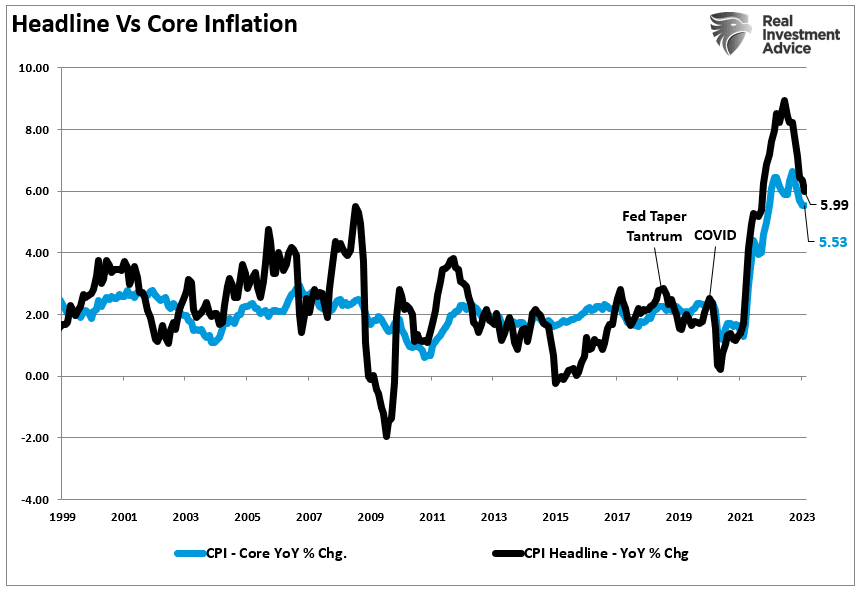
The latest inflation print was not “Fed friendly” as the market tried to interpret the 0.4% increase in CPI this past week. The Fed looks at the “core” inflation number, which has remained stubbornly high.
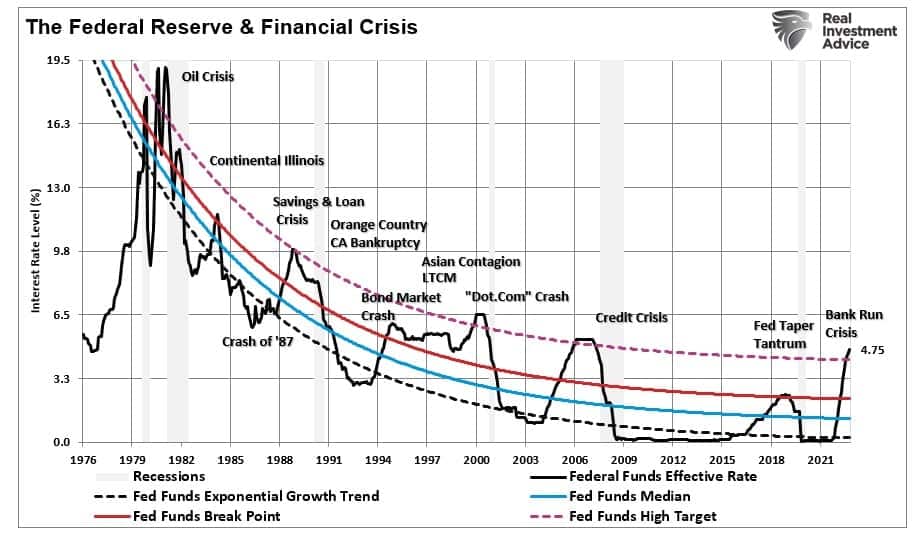
For the Federal Reserve, their primary concern remains a resurgence of inflation, as was seen in the 1970s. As shown, repeated bouts of inflationary pressures spurred repeated market events and recessions.
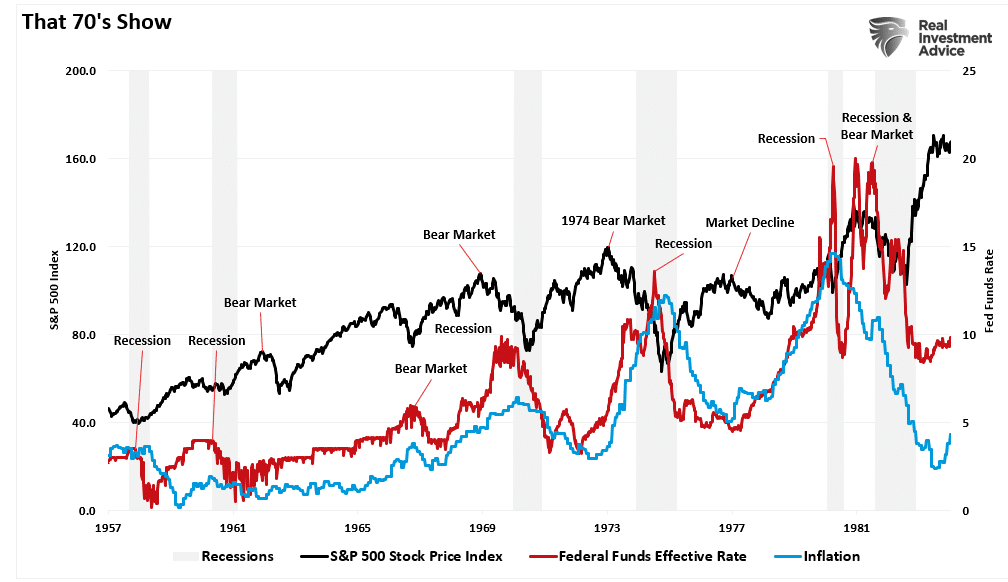
If the Fed eases monetary conditions too soon, they run the risk of another inflation surge in the economy. As shown, in 2020, the combination of zero interest rates and a massive injection of liquidity fueled the inflation surge.
However, throughout history, higher interest rates and monetary tightening eventually “broke something,” repeatedly creating financial instability or a recession.
That is the Fed’s “hard place.”
The Fed’s Hard Place
At the beginning of this year, I asked a question in our “2023 Investing Outlook.”
“The big question heading into 2023 is the dreaded “R” word. Can the U.S. economy avoid a “recession” amid the most aggressive rate hiking campaign by the Federal Reserve since 1980?“
As I stated then, anything is certainly possible. However, with economic activity impacted by higher rates and inflation, the odds of a recession seem elevated.
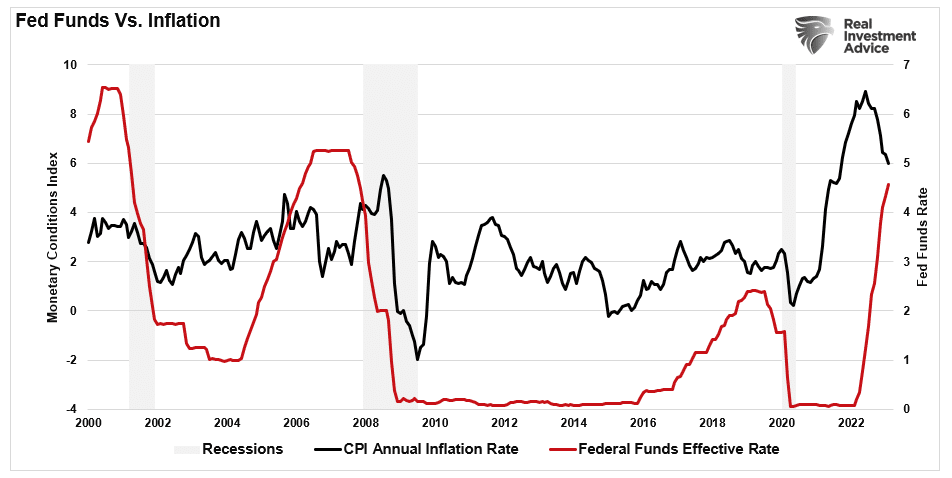
“As we head into 2023, we expect a rather sharp dollar decline. Such should be the consequence of Federal Reserve rate hikes and aggressive policy tightening, sparking an economic recession. As discussed, our monetary policy conditions index, which combines the dollar with inflation, interest rates, and Fed funds, suggests an economic contraction is the most likely outcome. Historically, a dollar decline coincides with economic slowdowns and recessions, which is not surprising as demand for goods declines.”
That index is updated and shown below. Importantly, it represents the Fed’s “hard place” of its next monetary policy decision. Throughout history, monetary policy spikes have resulted in financial instability, a recession, or both.

The problem is that in an economy dependent on debt for economic growth, higher rates eventually lead to an “event” as borrowing costs and payments increase. Or in the case of Silicon Valley Bank, a bank run on deposits at a time when collateral values are depressed because of an aggressive rate hiking campaign.
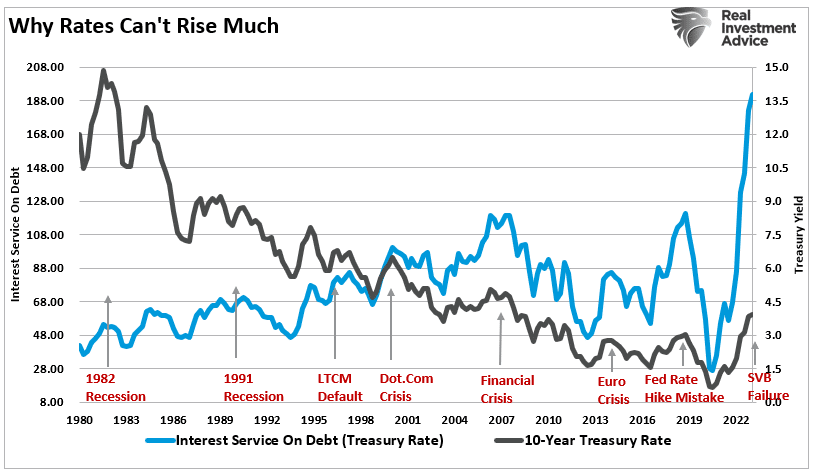
If the Fed chooses to solve financial instability, they risk spurring inflation. However, if they decide to keep fighting inflation, the risk of further financial instability increases. In an economy dependent on low-interest rates to support growth, the increases in debt are sensitive to rate changes.
As debt service increases, it diverts money from consumption which fuels economic growth. Such is why consumer delinquencies are now rising due to the massive amount of consumer credit at substantially higher rates.
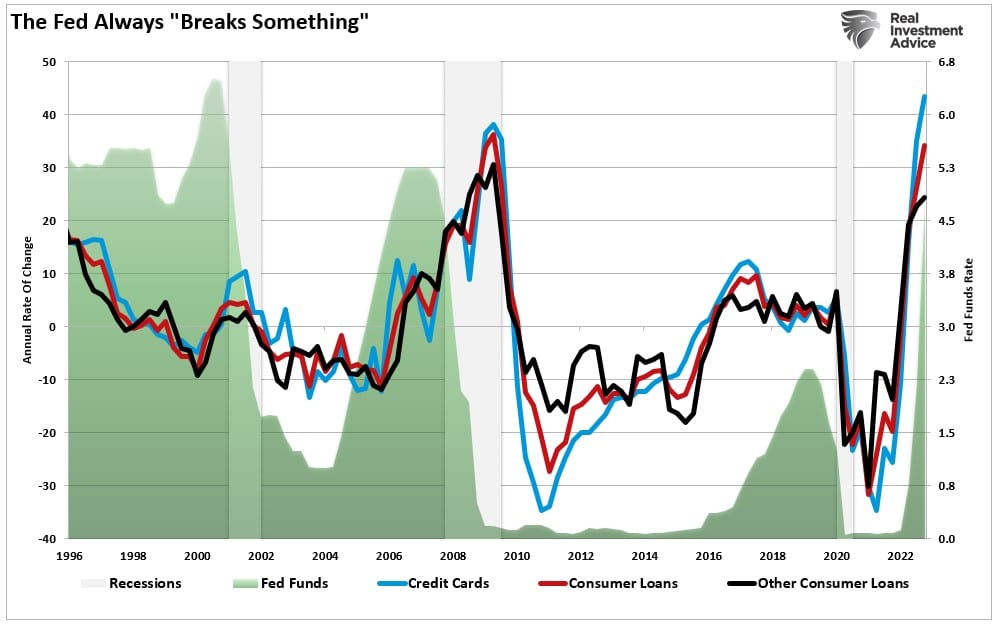
Notice that when the Fed begins cutting rates, delinquencies decline sharply. This is because the Fed has “broken something” economically, and debt is discharged through foreclosures, bankruptcies, and loan modifications.
Of course, given that consumption is roughly 70% of the economic growth calculation, the consumer is the lynchpin.
The Fed’s “No Win” Game
The Federal Reserve faces an incredibly tough choice next week. No matter what they choose to do, it seems to be a game they can’t win. If they solve the equation for financial stability, inflation increases and causes a recession. If they solve for inflation, the risk of financial instability increases.
I suspect the Fed will hike rates by 0.25% next but “soften” their language on the inflation front and specifically note that financial conditions in the economy are stable.
Our investment strategy for 2023 remains predicated on what happens when the yield curve UN-inverts. Interestingly, this un-inversion is part of the investor’s belief that the “Fed always blinks.”
The most likely outcome of the Fed’s most aggressive monetary campaign since 1980 is a recession. The Fed will eventually pivot to combat a recessionary outcome, but that, as noted previously, will not be stock friendly.
“Historically, when the Fed cuts interest rates, such is not the end of equity ‘bear markets,’ but rather the beginning. Such is shown in the chart below of previous ‘Fed pivots.’”
The chart below of the spread between the Fed Funds rate and the 10-year Treasury rate shows the risk. The analysis is a “yield curve” inversion. When the Fed funds rate is above the 10-year yield, such has preceded a bear market, recession, and/or a financial event.
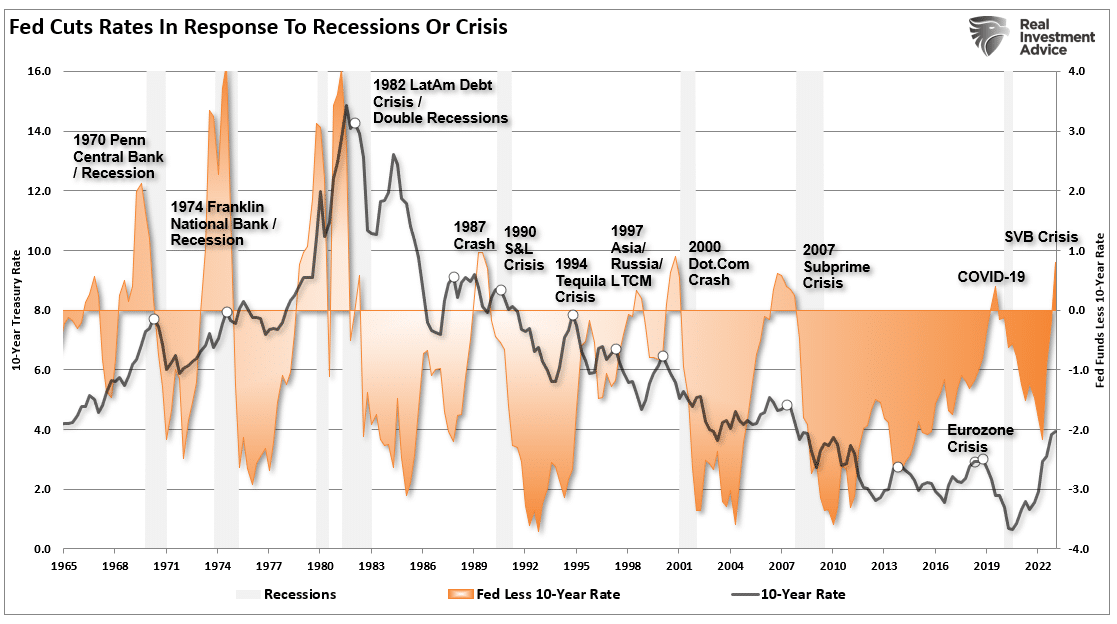
Currently, that spread, or inversion, is the highest since 1980.
The Silicon Valley Bank and Credit Suisse are likely just the first casualties of the Fed’s aggressive rate-hiking campaign. Notably, Credit Suisse is a SIFI (Systemically Important Financial Institution.) In other words, the size and scope of Credit Suisse, and its counter-party relationships with other major banks, are problematic if it fails. As seen with Lehman in 2008, the whole system will shudder if Credit Suisse fails.
While we are sure the bank will be rescued, we have no idea what else is particularly at risk.
As such, we suggest caution until the “smoke clears.”
How We Are Trading It
As the banking crisis unfolded last week, we started raising additional cash and eliminating economically sensitive sectors for now. While we like the companies that we own fundamentally, in the short term, fundamentals won’t protect capital when the market recognizes either a financial or recessionary event materializing. When things stabilize, we will revisit adding these sectors to our portfolios.
Those changes further reduced our equity exposures, increased cash levels, and left bond weighting unchanged. (The ETF allocation comprises short-duration Treasury bonds, floating rate, and long-dated Treasuries. You can view our models in real-time at SimpleVisor.com)

We are back to following our basic rules for counter-trend, oversold bounces for the time being.
- Move slowly. There is no rush to make dramatic changes. Doing anything in a moment of “panic” tends to be the wrong thing.
- If you are overweight equities, DO NOT try and fully adjust your portfolio to your target allocation in one move. Again, after significant declines, individuals feel like they “must” do something. Think logically about where you want to be and use the rally to adjust to that level.
- Begin by selling laggards and losers. These positions were dragging on performance as the market rose, and they led on the way down.
- Move “stop-loss” levels up to recent lows for each position.
- Be prepared to sell into the rally and reduce overall portfolio risk. As the rally ensues, you will start to second-guess selling. Avoid that emotional trap and follow through with your plan.
- If these rules make no sense, please consider hiring someone to manage your portfolio. It will be worth the additional expense over the long term.
While being cautious will likely underperform near term, reducing capital destruction allows for a quicker return to profitability.
Have a great week.
Research Report
Subscribe To “Before The Bell” For Daily Trading Updates (Formerly 3-Minutes)
We have set up a separate channel JUST for our short daily market updates. Be sure and subscribe to THIS CHANNEL to receive daily notifications before the market opens.
Click Here And Then Click The SUBSCRIBE Button
Subscribe To Our Youtube Channel To Get Notified Of All Our Videos
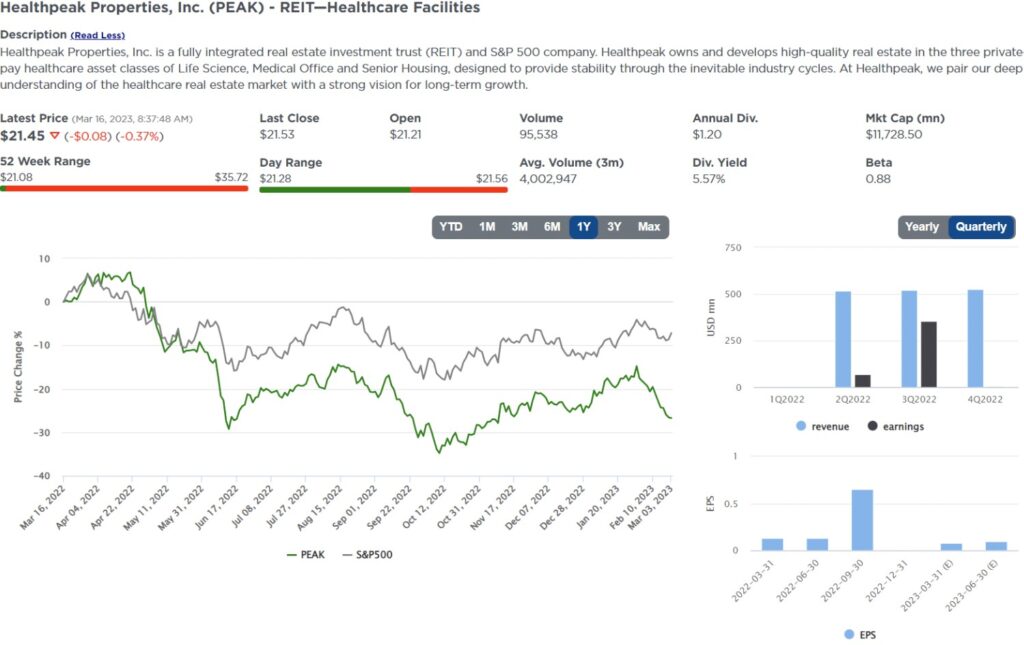
Stock Of The Week In Review
Shares in REIT stocks have recently fallen on hard times for a few reasons. First, investors fear higher interest and mortgage rates will negatively impact real estate valuations. Second, with a recession pending, the odds of higher vacancy rates and delinquencies are more acute. Lastly, with risk-free U.S. Treasuries recently eclipsing 5%, why buy riskier REITs, many of which have similar yields as Treasury notes?
While the concerns are valid, some REITs are being unjustly sold off with the entire sector as investors focus on reducing exposure to the industry. This week’s screen focuses solely on Residential and Healthcare REITs as they are real estate sectors with solid growth prospects and are somewhat recession-proof.
REITs are commonly assessed using Price to FFO (funds from operations) instead of price to earnings or price to cash flow. FFO is the cash generated by the REIT, which factors in depreciation, an essential factor in REIT management.
Here is a link to the full SimpleVisor Article For Step-By-Step Screening Instructions.
Login to Simplevisor.com to read the full 5-For-Friday report.
Daily Commentary Tidbits
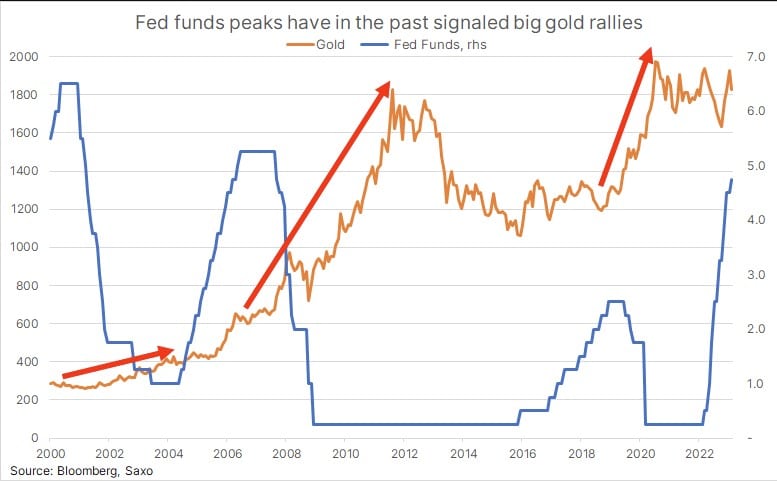
As noted in the opening, the market expects the Fed to cut rates aggressively later this year. As the market rapidly repriced Fed Fund expectations, gold rose sharply. Gold rose over $100 per ounce in just the last week. Gold is not necessarily soaring because of banking problems. The graph below from Ole Hansen of Saxo Bank shows that gold tends to have strong rallies when the Fed lowers interest rates. Gold investors are betting on an easy Fed. We also wrote about this phenomenon in Gold Investors Are Betting on the Fed. To wit:
The bottom line, gold prices are highly correlated with real yields when real yields are near or below zero. The correlation is negative, meaning that as real yields fall, gold prices rise. Said differently, gold prices increase when the Fed enacts a monetary policy that is too stimulative given the circumstances.
If the market is correct and the Fed is close to starting an easing campaign, gold may be in the early innings of a rally. However, gold can easily give up recent gains if fighting inflation remains goal number one. Longer term, the odds of a recession are high, in our opinion. Therefore a gold rally and decline in Fed Funds is likely, but it may not start yet.
Click Here To Read The Latest Daily Market Commentary (Subscribe For Pre-Market Email)
Bull Bear Report Market Statistics & Screens

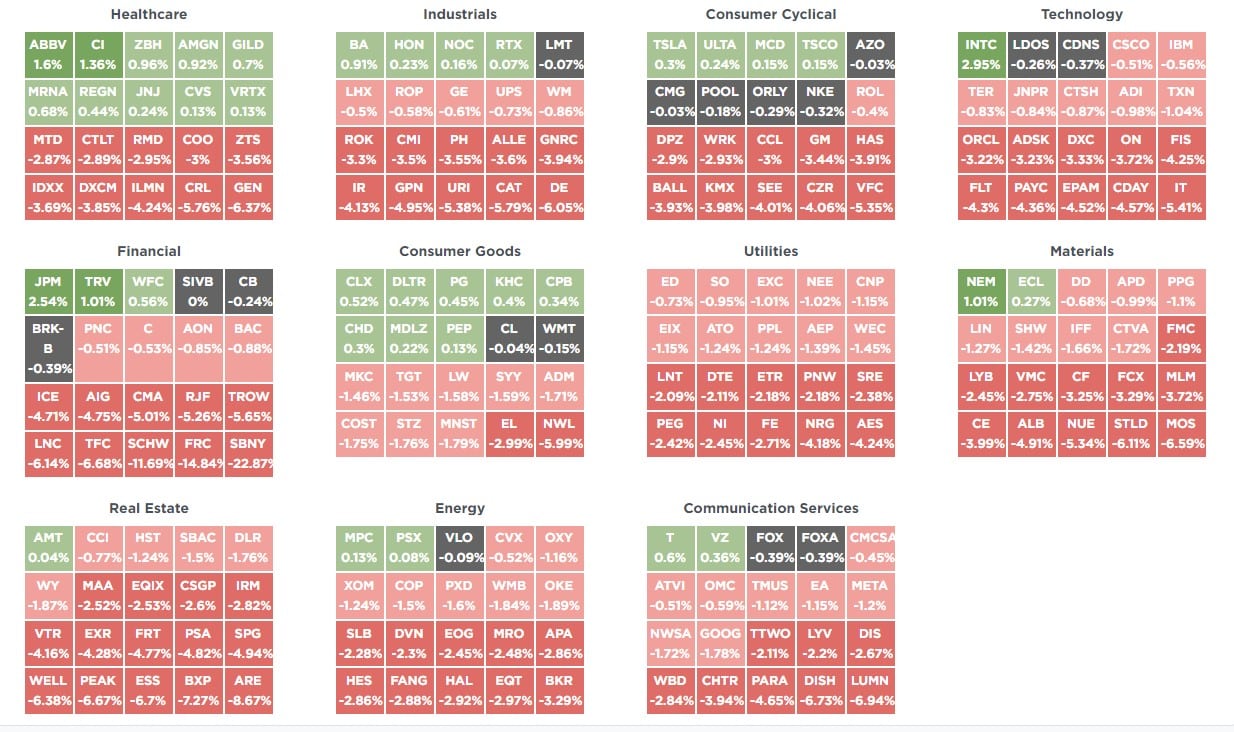
SimpleVisor Top & Bottom Performers By Sector
S&P 500 Weekly Tear Sheet
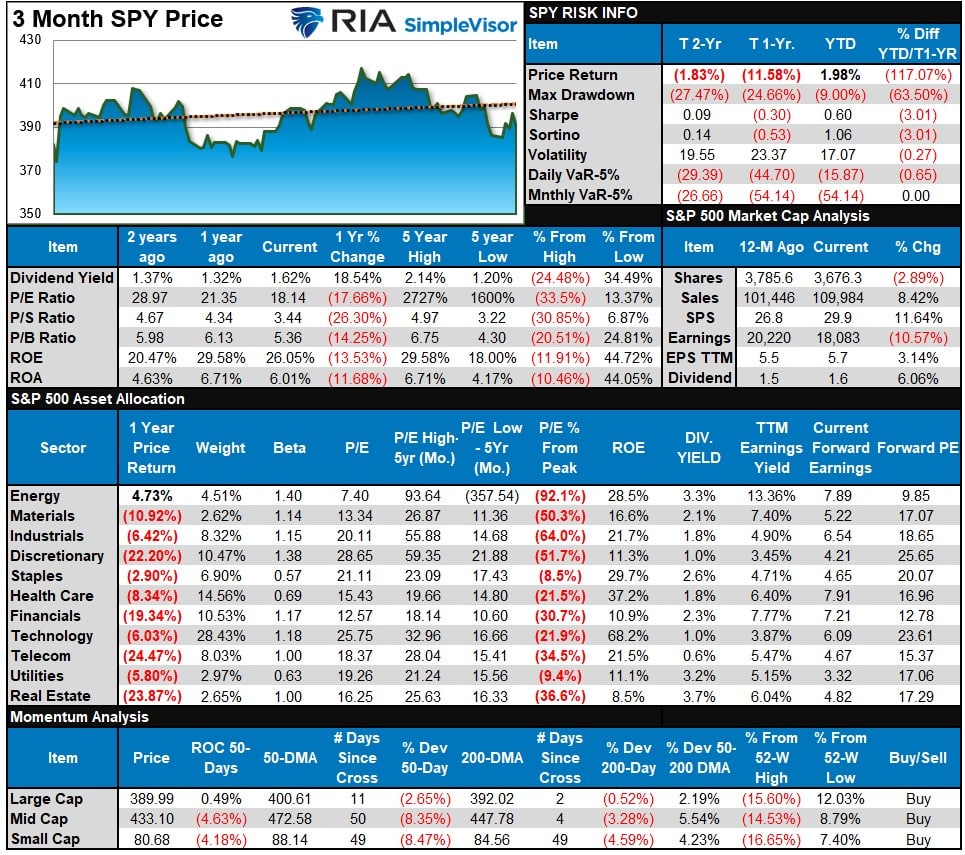
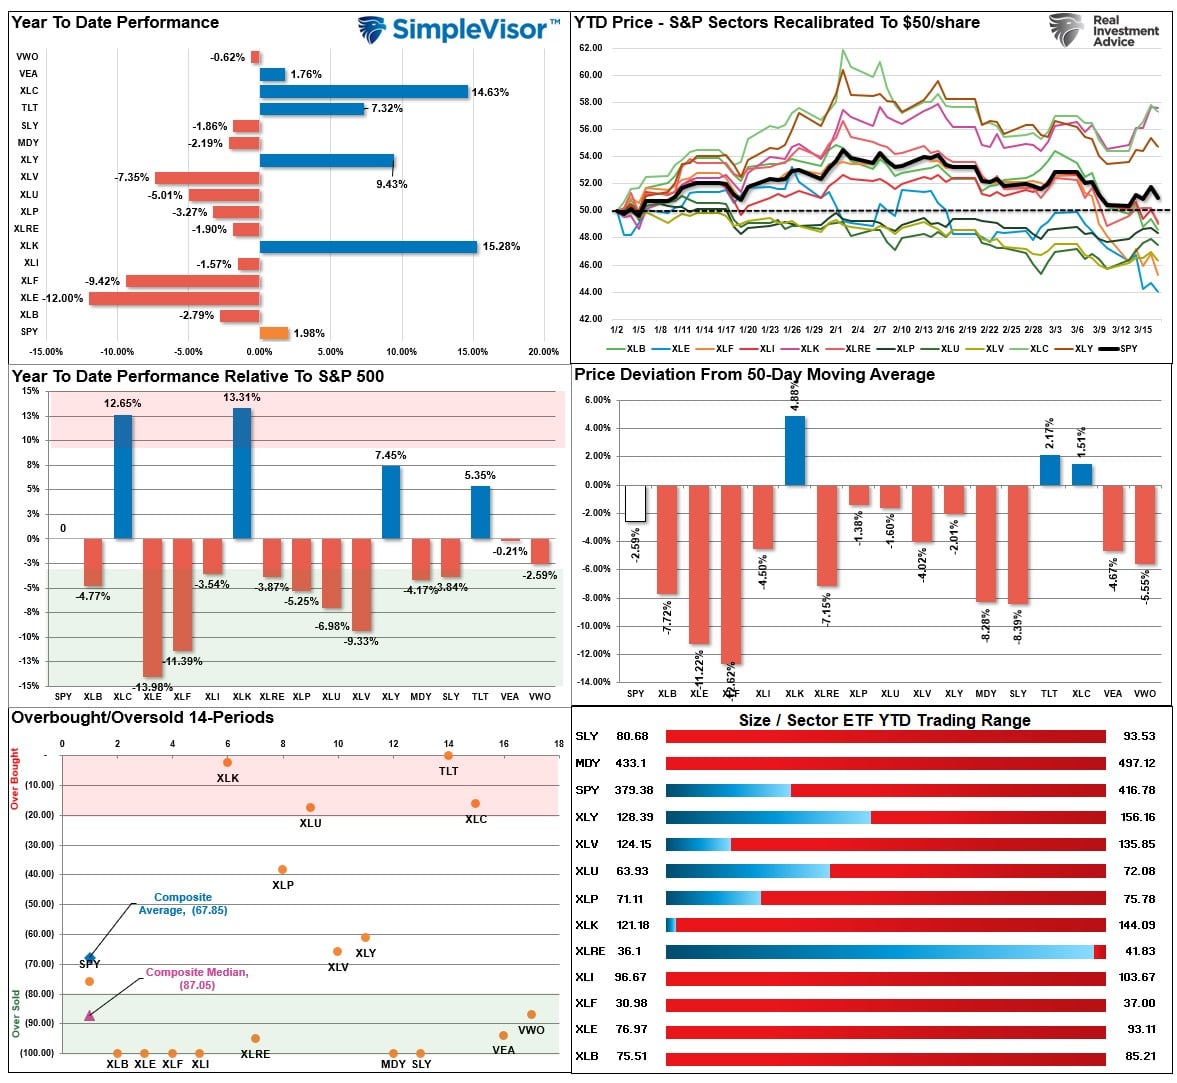
Relative Performance Analysis
In a very interesting change in performance, and something we suggested at the end of 2022, was that last year’s big performers were likely to underperform in 2023, and vice versa. Such has indeed been the case as Bonds and Technology stocks are vastly outperforming this year with Energy dragging way behind. Technology and Bonds are very overbought short-term, so look for a rotation in the markets starting next week as money potentially fows into beaten up sectors.
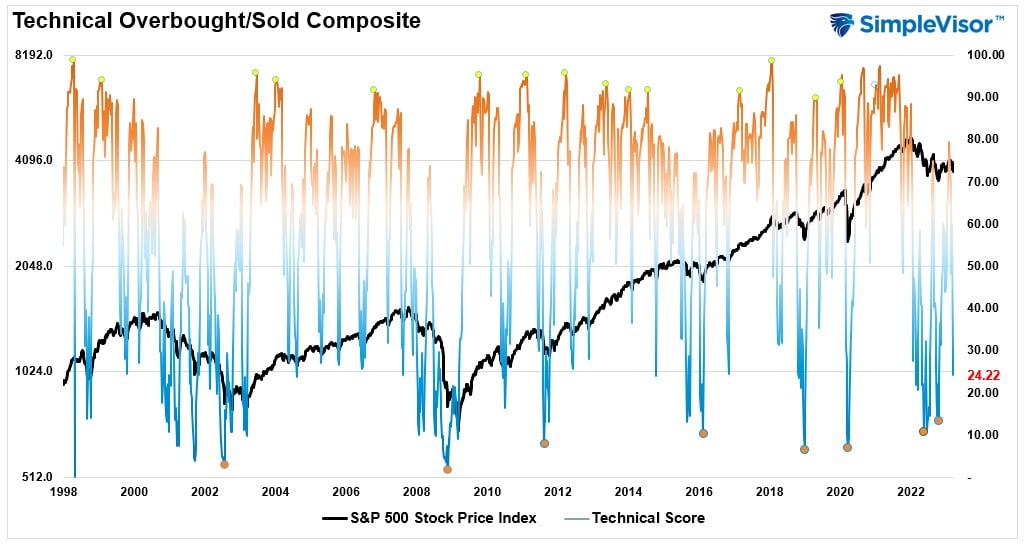
Technical Composite
The technical overbought/sold gauge comprises several price indicators (RSI, Williams %R, etc.), measured using “weekly” closing price data. Readings above “80” are considered overbought, and below “20” are oversold. Markets peak when those readings are 80 or above, suggesting prudent profit-taking and risk management. The best buying opportunities exist when those readings are 20 or below.
The current reading is 24.22 out of a possible 100.
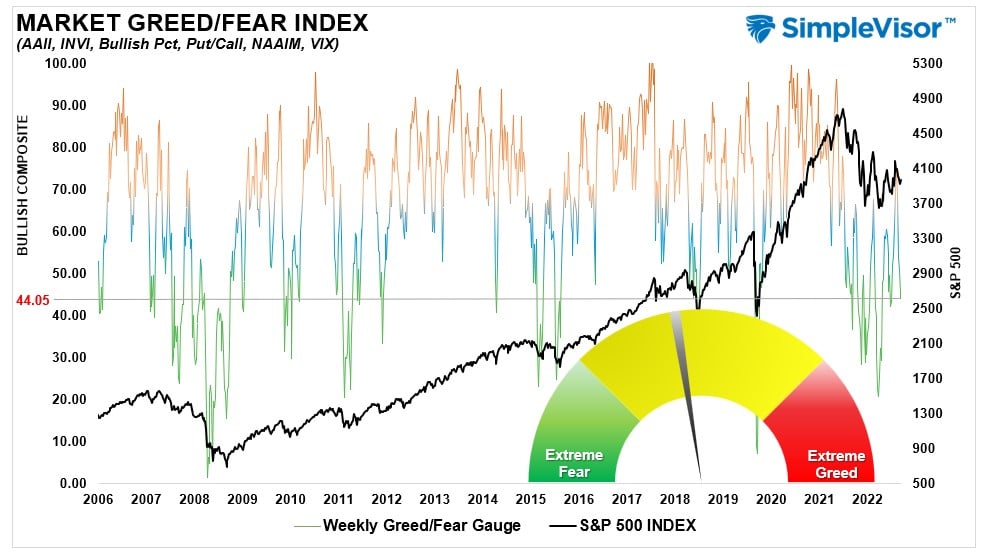
Portfolio Positioning “Fear / Greed” Gauge
The “Fear/Greed” Gauge is how individual and professional investors are “positioning” themselves in the market based on their equity exposure. From a contrarian position, the higher the allocation to equities, the more likely the market is closer to a correction than not. The gauge uses weekly closing data.
NOTE: The Fear/Greed Index measures risk from 0 to 100. It is a rarity that it reaches levels above 90. The current reading is 44.05 out of a possible 100.
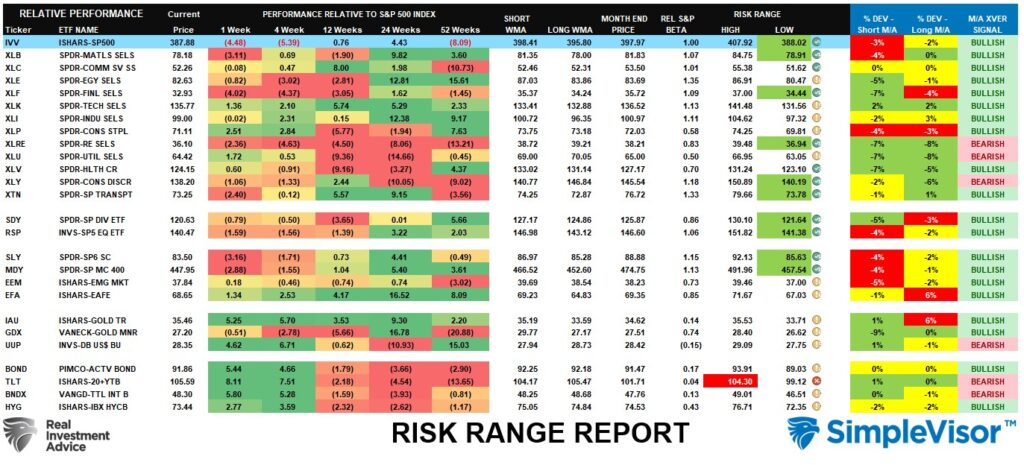
Sector Model Analysis & Risk Ranges
How To Read This Table
- The table compares the relative performance of each sector and market to the S&P 500 index.
- “M” XVER” “Moving Average Cross Over) is determined by the short-term weekly moving average crossing positively or negatively with the long-term weekly moving average.
- The risk range is a function of the month-end closing price and the “beta” of the sector or market. (Ranges reset on the 1st of each month)
- The table shows the price deviation above and below the weekly moving averages.
As noted above, the one-two punch of Powell and Silicon Valley Bank pushed all sectors and markets lower this week. While the bears have regained control of the narrative for now, expect a bounce next week, given the current oversold conditions. Bonds are overbought after a big spike on Friday, so some profit-taking there is advised.
Weekly SimpleVisor Stock Screens
We provide three stock screens each week from SimpleVisor.
This week we are searching for the Top 20:
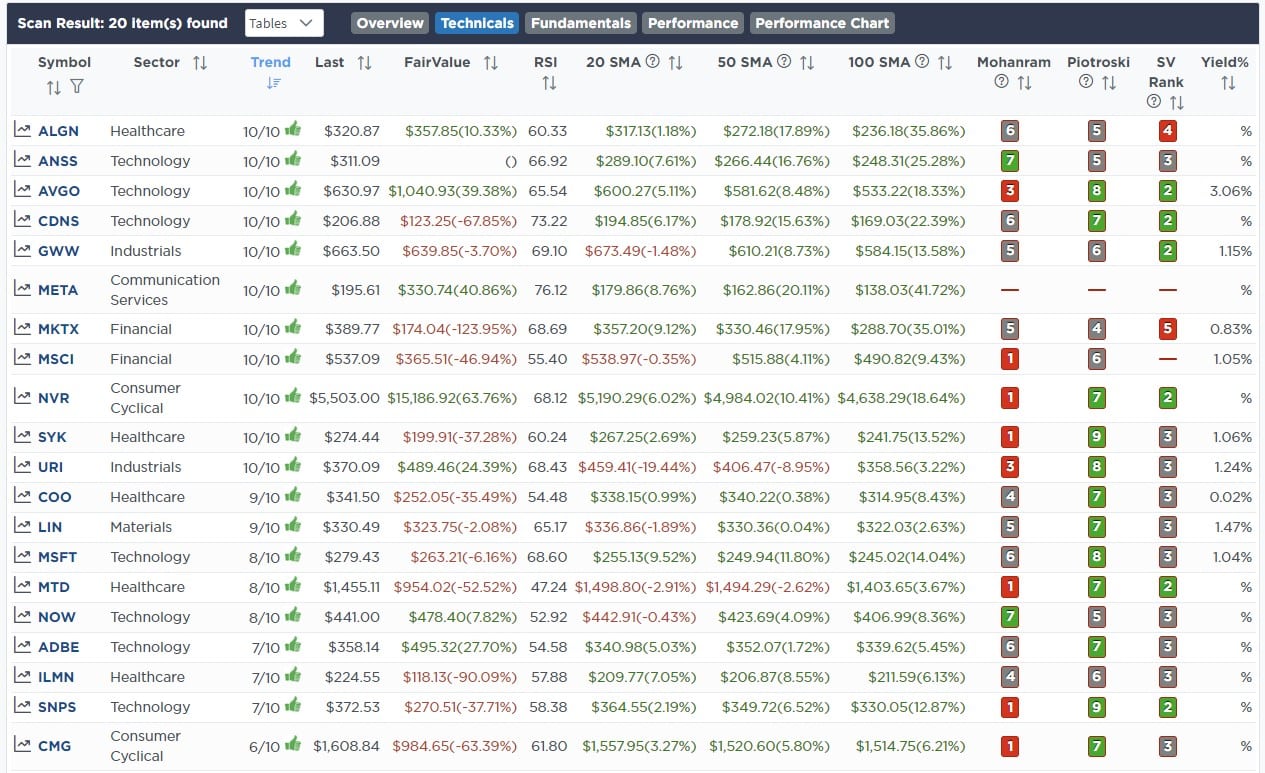
- Relative Strength Stocks
- Momentum Stocks
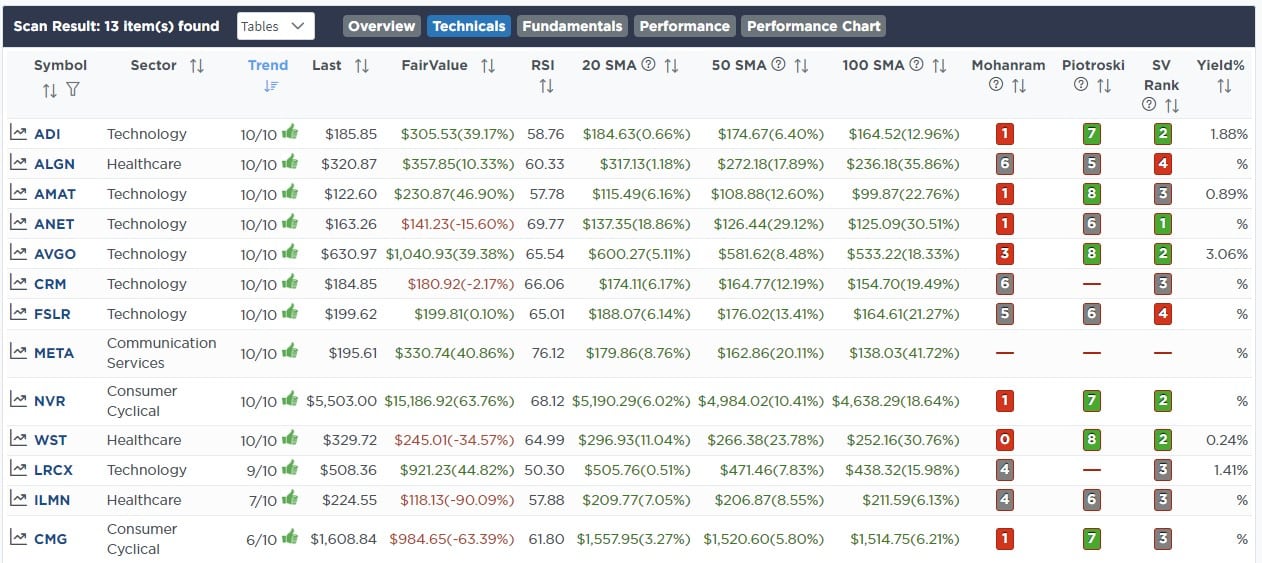
- Fundamental And Technically Strong Stocks
(Click Images To Enlarge)
RSI Screen
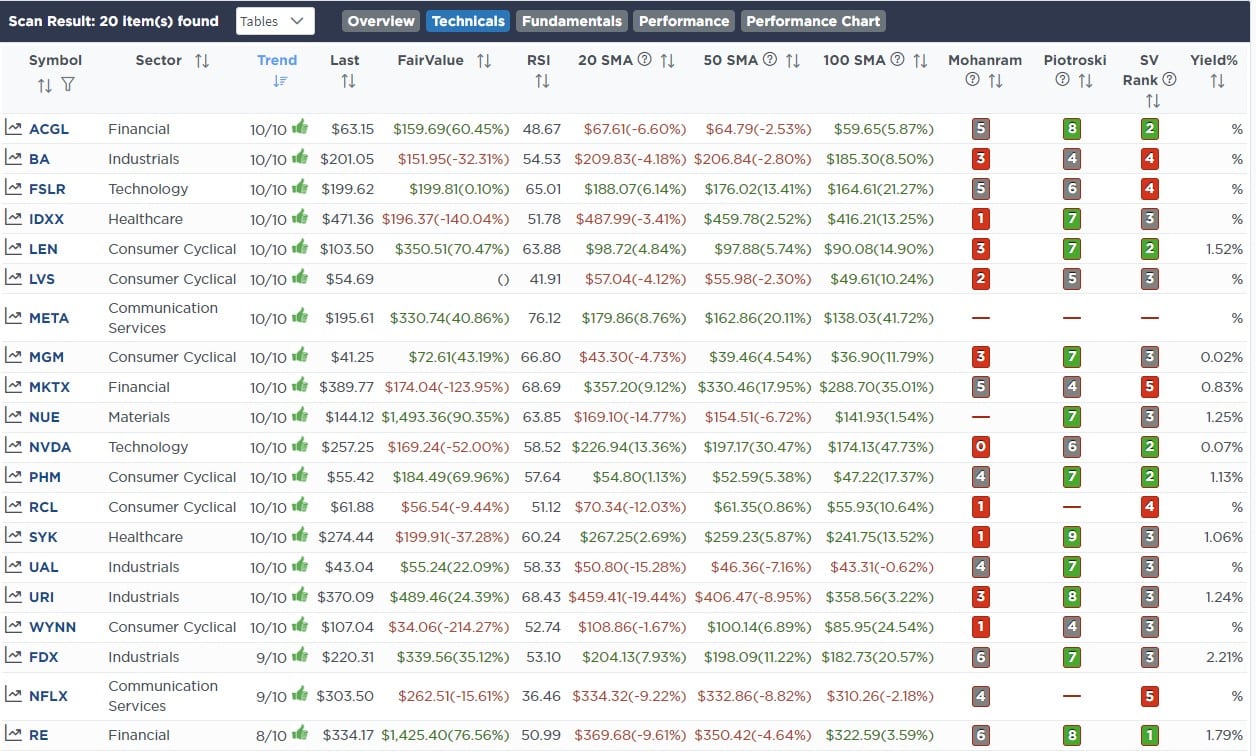
Momentum Screen
Fundamental Stocks With Strong Technicals
SimpleVisor Portfolio Changes
We post all of our portfolio changes as they occur at SimpleVisor:
March 15th
The financial issues with Silicon Valley Bank, First Republic, and Credit Suisse are likely the first signs that the Fed has “broken something” in the markets. Additionally, the market has taken out important support levels at the 200-DMA and the rising trend line from the October lows. As such, the bears are now officially in charge of the narrative. With the MACD sell signal intact, and the Fed meeting next week, the risk to our portfolios is higher than we like, given the fluid and uncertain situation we are currently faced with.
Therefore, after selling all of the financial exposure previously, we are removing our basic materials and energy exposures today. While we fundamentally like the companies we own, and the dividend they provide, their sensitivity to economic fallout is very high. Therefore, we will step aside for now and let the market tell us what to do next.
Equity Model
- Sell 100% of Devon Energy (DVN), EQT, Inc. (EQT), and Conoco Phillips (COP)
- Liquidate 100% of Albamarle (ALB)
ETF Model
- Sell 100% of iShares Basic Materials (XLB)
- Liquidate 100% of Global Z Lithium & Battery Tech (LIT)
- Sell 100% of iShares Energy (XLE)

Lance Roberts, CIO
Have a great week!


Lance Roberts is a Chief Portfolio Strategist/Economist for RIA Advisors. He is also the host of “The Lance Roberts Podcast” and Chief Editor of the “Real Investment Advice” website and author of “Real Investment Daily” blog and “Real Investment Report“. Follow Lance on Facebook, Twitter, Linked-In and YouTube
Customer Relationship Summary (Form CRS)