


Inside This Week’s Bull Bear Report
- Market Rocked By Weak Data & Hawkish Fed
- 4-Important Tidbits Worth Paying Attention To
- How We Are Trading It
- Research Report – Is The Fed Trying To Wean Markets Off Monetary Policy
- Youtube – Before The Bell
- Stock Of The Week
- Daily Commentary Bits
- Market Statistics
- Stock Screens
- Portfolio Trades This Week
Market Rocked By Weak Data And Hawkish Fed
This week’s report will cover several tidbits of data impacting the market over the last week.
The most critical tidbit came from St Louis Fed president Jim Bullard (a non-voter this year), who spoke to the WSJ’s Fed Mouthpiece Nick Timiraos. He stated that while US interest rates have to rise further to ensure that inflationary pressures recede, “the US is now ‘almost’ in the restrictive territory.”
That point was echoed by Loretta Mester, as the Fed wants to ensure inflation will come down on a steady path to the 2% target. “I just think we need to keep going, and we’ll discuss how much to do at the next meeting.” Mester said that she expects the Fed’s policy rate to go “a bit higher” than 5% and stay there for some time to slow inflation further.
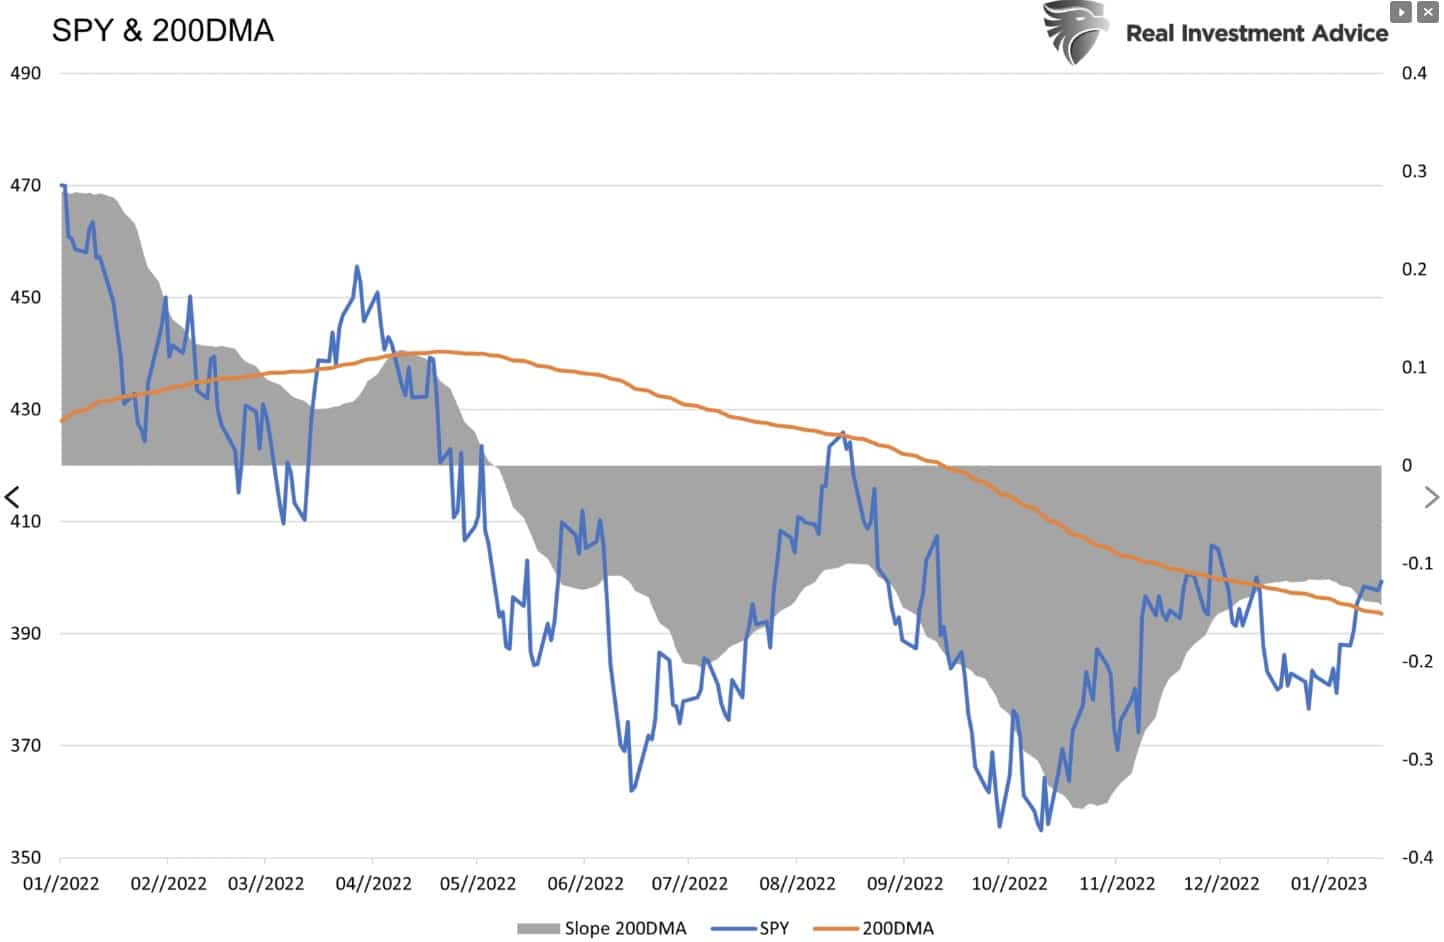
That tidbit of commentary sent the markets lower on Wednesday and Thursday and retested support where the 20- and 100-DMA currently reside. On Friday, the market gathered steam bouncing off support and rushing back to the 200-DMA resistance. The bulls remain in charge with the MACD “buy signal” intact.
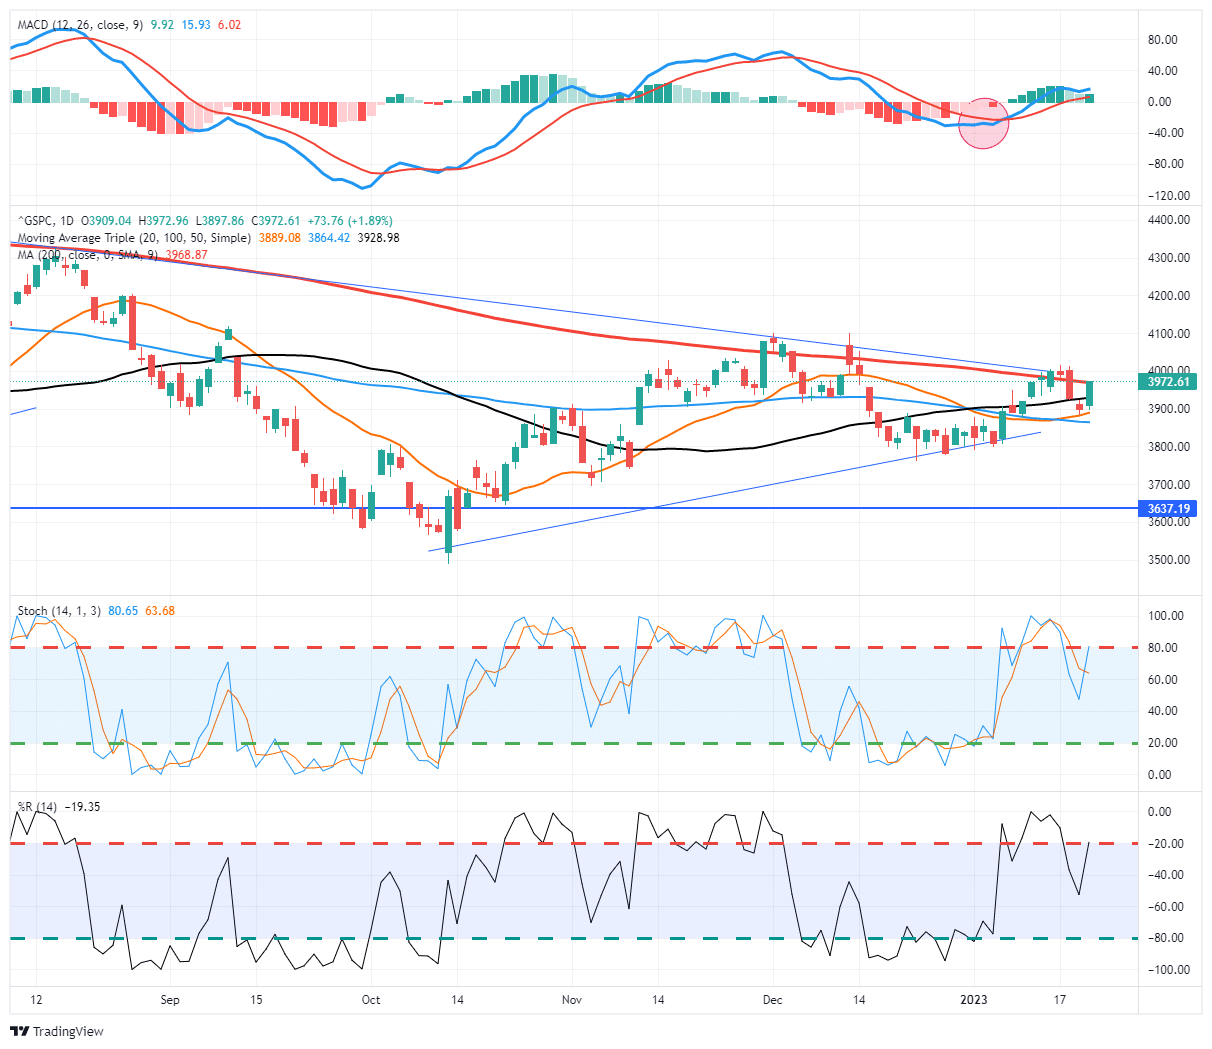
However, as noted in last week’s commentary, the sell-off was not unexpected.
“The market is exceptionally overbought short-term, so expect some profit-taking next week and a bit more sloppy trading action. With earnings kicking off this week, and the Fed coming up, who will likely talk down the market, be cautious about taking on too much exposure now.”
Our concern remains that while the Fed is suggesting further tightening, the 3-month average of inflation has already returned to the Fed’s target rate. Such means the Fed is running a significant risk in overtightening policy and causing a sharper economic downturn than is currently priced into asset prices.

Several tidbits of data support that case and what likely comes next. While the bulls currently seem to be clearly in control of the markets, ample data suggests further risk in the months ahead.
Need Help With Your Investing Strategy?
Are you looking for complete financial, insurance, and estate planning? Need a risk-managed portfolio management strategy to grow and protect your savings? Whatever your needs are, we are here to help.

Tidbit 1 – PPI Falls Sharply Confirming Disinflation
On Wednesday, the Producer Price Index (PPI) fell sharply to a 6.9% annual rate.
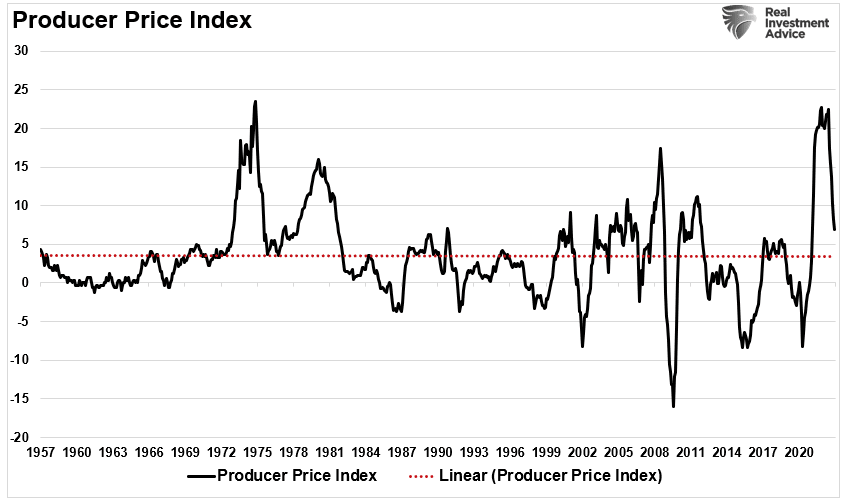
That decline further emphasizes that the economy is slowing, and the inflationary pressures of last year are subsiding as the monetary impulse fades from the system. Such was a point we discussed recently in “The Lag Effect.”
“The massive surge in stimulus sent directly to households resulted in an unprecedented spike in ‘savings,’ creating artificial demand. As shown, the ‘pig in the python’ effect is evident. Over the next two years, that ‘bulge’ of excess liquidity will revert to the previous growth trend. Economic growth will lag the reversion in savings by about 12 months. This ‘lag effect’ is critical to monetary policy outcomes.
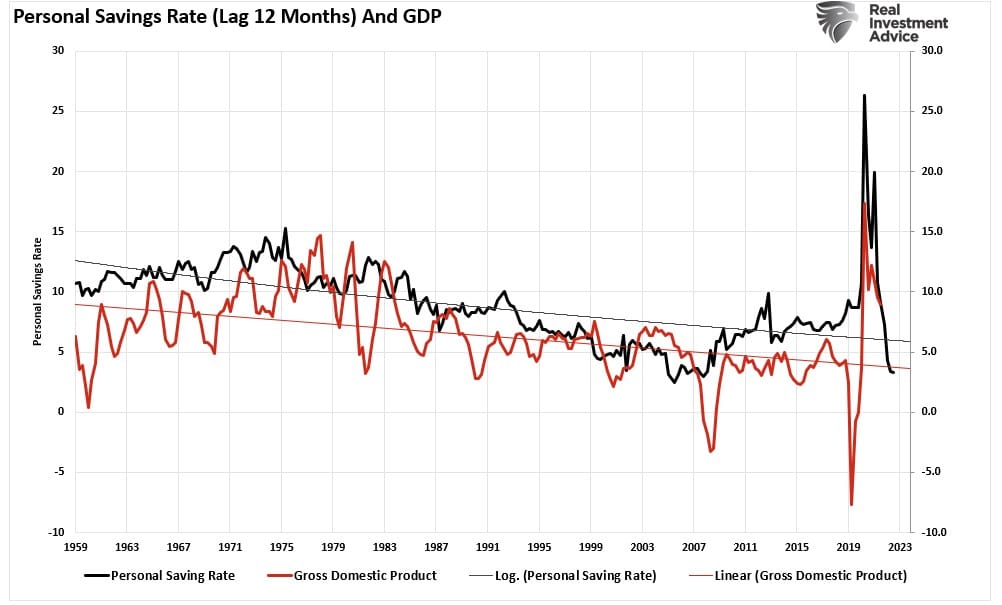
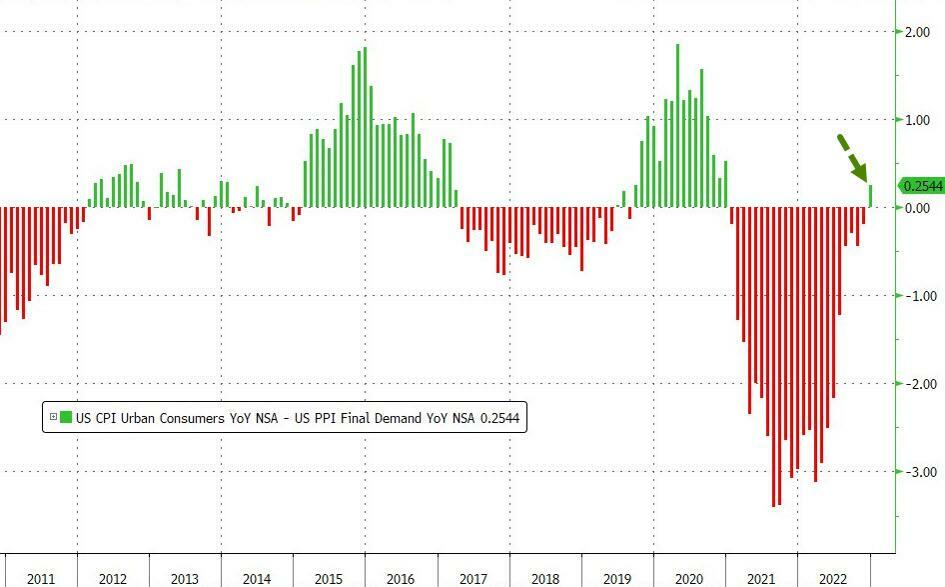
This “lag effect” will continue to impact the economy as disinflation becomes more prevalent significantly. We noted that when the spread between the consumer price index (CPI) and the producer price index (PPI) became very elevated, such has coincided with recessions, bear markets, or economic events. The reason is that when that spread is elevated, such suggests that producers cannot pass along higher costs to consumers.
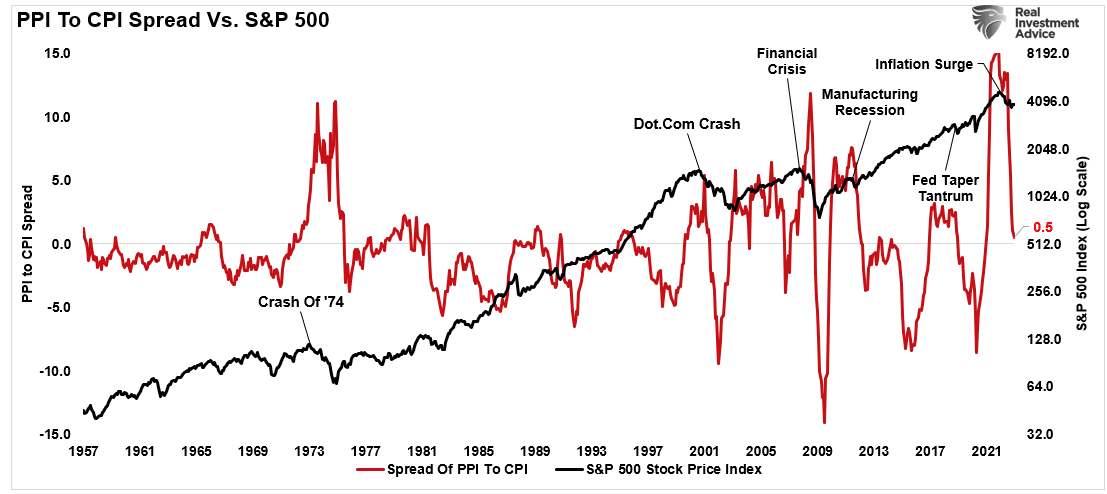
As shown below, those bottlenecked costs eventually affect corporate profit margins and earnings. Not surprisingly, earnings are reverting as the economy slows down due to higher rates and inflation.
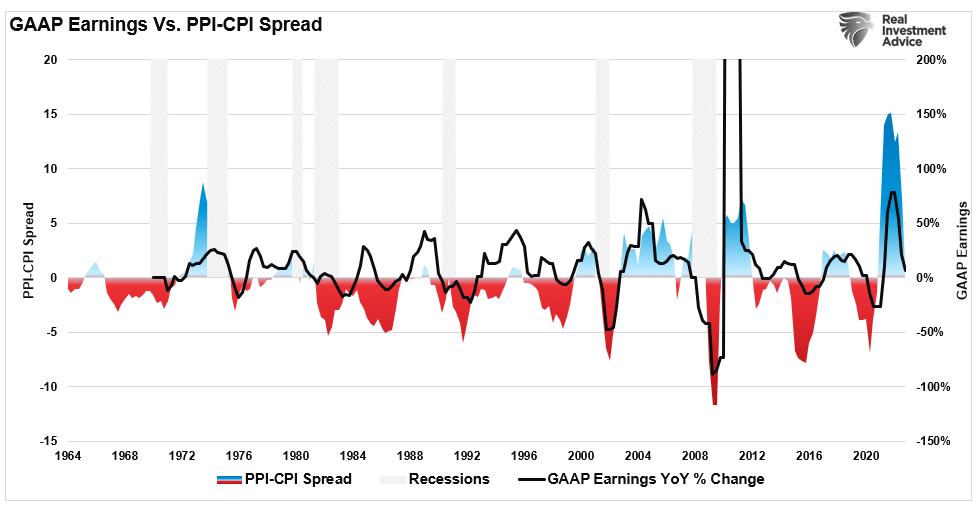
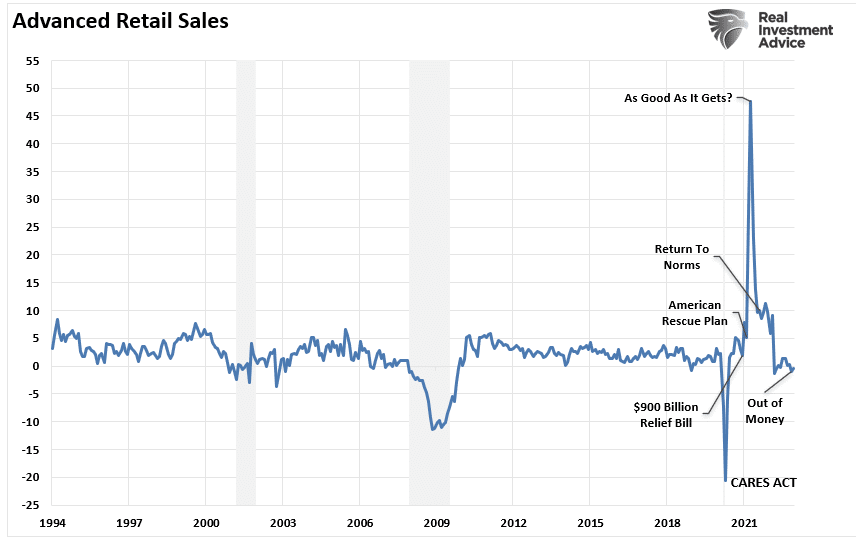
For investors, the disinflationary pressures in the economy are building as the massive surge of liquidity exits the economy fully over the next year. Pay attention to corporate earnings over the next couple of weeks. I suspect we will see more mentions of slowing demand if December retail sales are any indication.
A good example was during Thursday’s Procter & Gamble (PG) report.
“The company now anticipates headwinds of $3.7 billion for the remainder of its fiscal year, it said Thursday, marking a slight improvement. But it warned those headwinds would continue to squeeze P&G’s gross margins, which saw a 160 basis point decrease during the second quarter versus a year ago.” – CNBC
Another tidbit worth remembering is that corporate earnings primarily come from what consumers do in an economy ~70% driven by consumption.
Such, as noted, is why profit margins are at risk.
Tidbit 2 – How Long Until A Recession?
The considerable debate currently is “when is the next recession?”
Such is always an impossible question to answer precisely because of the many data points that impact the economy over various time frames. However, indicators, such as the inversion of different yield curves, can provide clues as to the potential for a recession. As we discussed in the “Media’s Denial Of History:”
“Most of the yield spreads we monitor, shown below, have yet to invert. However, the best signals of a recessionary onset occur when a bulk of the yield spreads turn negative simultaneously. However, even then, it was several months before the economy slipped into recession.”
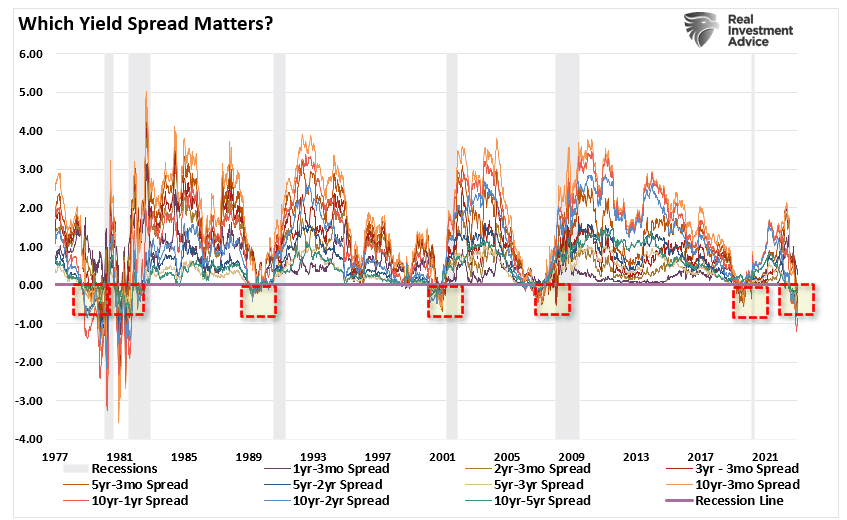
“When numerous yield spreads turn negative, the media will discount the risk of a recession and suggest the yield curve is wrong this time. However, the bond market is already discounting weaker economic growth, earnings risk, elevated valuations, and a reversal of monetary support.”
Historically, a recession follows when 50% or more of the tracked yield curves invert. Every time. (Read this for a complete history.)
We are currently at 90%.
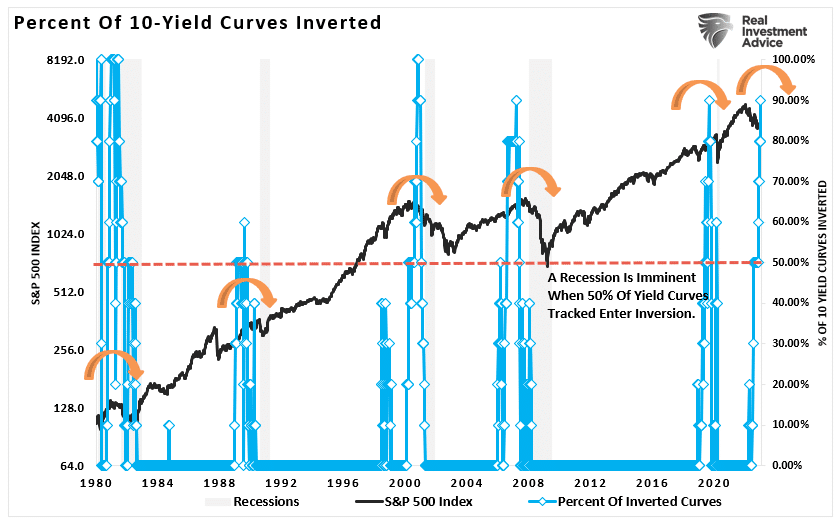
Here is a tidbit of information to consider. The average time between a yield curve inversion and a recession is roughly 19 months.

If that is the case, we are roughly about 9-months from the onset of a recession.
Tidbit 3 – Profit Margins Are At Risk
If a recession is pending, my colleague Albert Edwards makes a critical point concerning profit margins.
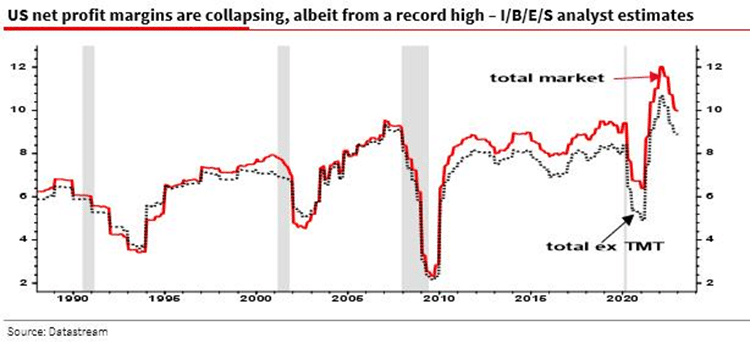
“One element that factors into our thinking more than other economists is the state of corporate profits. We believe profits lead the investment cycle and are usually the deciding factor in causing recessions.
To the extent that I believe it is the response of the corporate sector to downward pressure on profits that ‘causes’ recessions, this fall in margins is a key leading indicator. Optimists may say margins still remain high and companies can absorb this pain, but history indicates that any substantial decline in profit margins precedes a recession (see chart below).
There is more risk to profit margins than just an economic downturn.
That spike in profit margins was the convergence of several one-time events:
- An economic shutdown cut many payrolls, the most significant expense to a company’s income.
- At the same time, the Government sent checks to households fueling demand.
- An inability to produce inventory sent prices skyrocketing (inflation).
With low payrolls and surging prices, companies developed massive profit margins.
Today, that situation is running entirely in reverse. Wages have risen sharply, borrowing costs are rising, too much inventory is reducing prices, demand is slowing, and no more stimulus is on the horizon.
So, exactly how do you plan to sustain record margins?
Tidbit 4 – 0DTE (Zero Days To Expiration)
“The volatility index (VIX) is broken.”
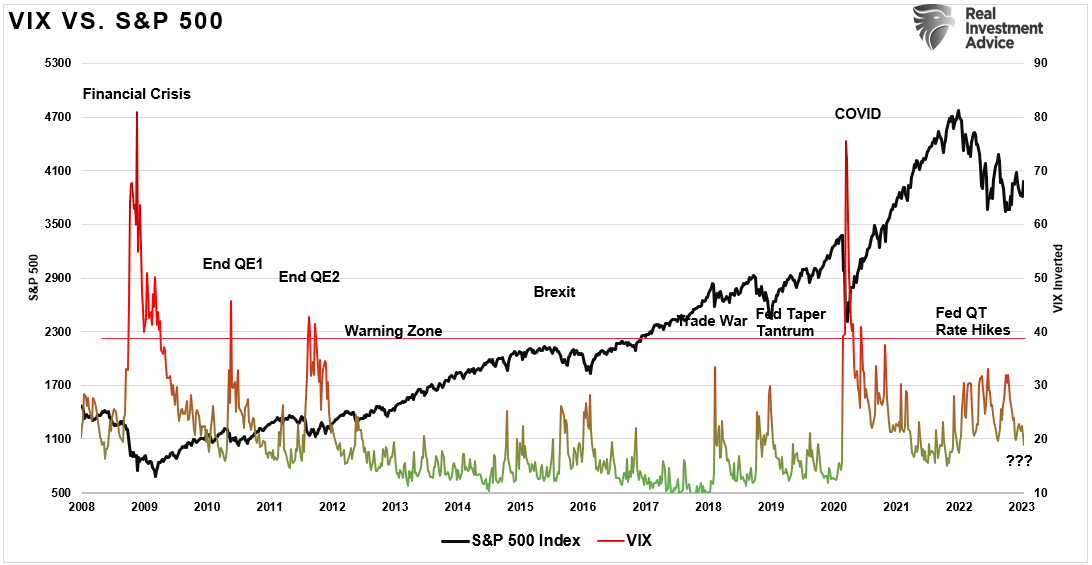
I have gotten quite a few emails stating that the “VIX” no longer accurately represents the “fear” of the market. Such may be a more accurate statement than many think.
Historically, the volatility index has sharply increased during market downturns as investors scrambled to buy protection against the market decline. Such was not the case in 2020, as volatility remained subdued despite the market downturn.
There has been a significant change in the options market over the last several quarters, explaining this change in the behavior of the volatility index.
Despite its growing popularity among retail investors and influence on markets, “0DTE” is a term unfamiliar to most investors.
“0DTE” stands for zero days until options expire.
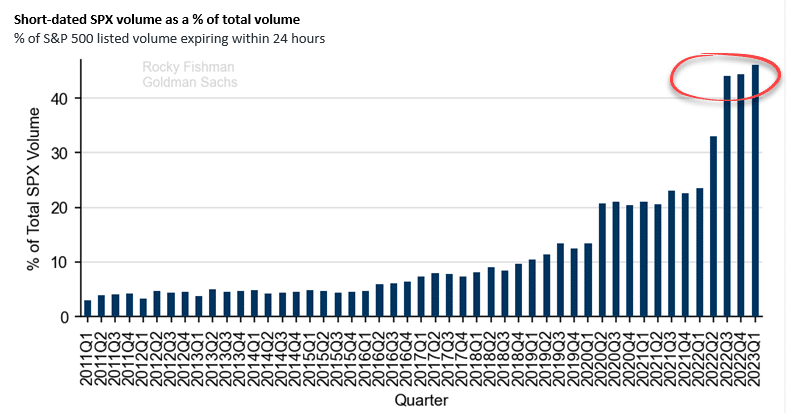
These are put-and-call options on individual stocks and indexes that expire within 24 hours. As the chart shows, almost half of the options volume on the S&P 500 is 0DTE. Such dwarfs the single-digit rates existing before the pandemic.
More importantly, the traditional measure of “fear and greed” in the financial markets, the VIX, does not consider these 0DTE options.
Given the minimal time until these options expire, most of the activity in 0DTE options is likely due to speculators. In many cases, volume on 0DTE options spikes before crucial economic data releases. Wall Street banks, which reside on the other side of 0DTE trades, must hedge them. To hedge those 0DTE options, Wall Street must buy or short the underlying index or stock as it moves in favor of the owner of the option.
The growing concern is that as 0DTE option interest grows, dealers must actively hedge more significant amounts. Banks must buy or sell aggressively if the options trades are correct, either bullish or bearish. Such could exaggerate an already significant market move.
This change to the market may have rendered the VIX index more ineffectual in navigating market risk in either direction. While these options trades accelerated in 2022, given the pickup in market volatility, the long-running trend of increased activity seems here to stay.
Not Getting The Bull Bear Report Each Week In Your Mailbox? Subscribe Here For Free.
How We Are Trading It
These tidbits of information show the complexity of the market environment we are dealing with. Last week, we discussed the technical improvement of the market and that we were adding some exposure to our portfolios.
“We did add some equity exposure this past week by adding back some of our energy positions we sold near recent peaks and a trading position in the S&P 500 equal weight index. We are also contemplating an increase in the duration of our bond portfolio following the most recent CPI report. The spread now between Treasury bonds, and the 3-month rate of inflation has now become extremely attractive. As we noted previously, there is a rising probability that bonds will outperform stocks in 2023. Such will result from disinflation becoming a deflationary (read: recessionary) environment.”
This week’s tidbits continue to support a more bearish outlook for the economy and potentially weaker markets in the year ahead. Our view has not changed.
“The most likely outcome of the Fed’s most aggressive monetary campaign in history is a recession. Such would lead to an immediate policy reversal. Crucially, the Fed controls the short end of the curve, but the economy and inflation control the long end. Therefore, as the recession takes hold, interest rates will decline on the long end of the curve. However, such will lead to a deeper reversion in yields until something “breaks.“ Only then will the Federal Reserve begin to cut rates.”
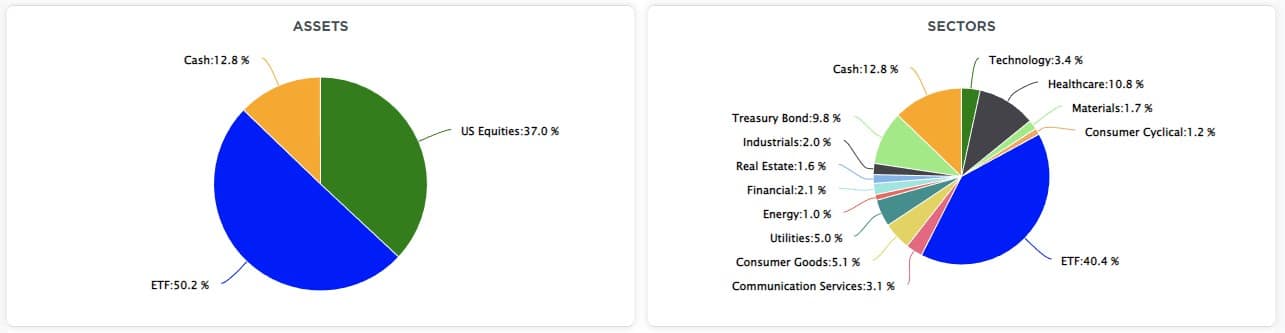
Therefore, from an allocation standpoint, we remain underweight in stocks and bonds and overweight cash and short-term Treasuries. (The ETF allocation comprises short-duration Treasury bonds and floating rate Treasuries, with a lesser allocation to long-dated Treasuries. You can view our models in real-time at SimpleVisor.com)
This week’s tidbits reinforce that we must adhere to our portfolio management process. However, more importantly, is that we remain nimble to adjust to what we expect will be another frustrating market this year.
- Tighten up stop-loss levels to current support levels for each position.
- Hedge portfolios against significant market declines.
- Take profits in positions that have been big winners
- Sell laggards and losers.
- Raise cash and rebalance portfolios to target weightings.
See you next week.
Research Report
Subscribe To “Before The Bell” For Daily Trading Updates (Formerly 3-Minutes)
We have set up a separate channel JUST for our short daily market updates. Be sure and subscribe to THIS CHANNEL to receive daily notifications before the market opens.
Click Here And Then Click The SUBSCRIBE Button
Subscribe To Our Youtube Channel To Get Notified Of All Our Videos
Stock Of The Week In Review
Following up on Part 1 of our Dividends and Value series, we take a different approach to finding dividend stocks with a value orientation. This second scan starts with the 65 Dividend Aristocrats. To be considered an Aristocrat, the company must have paid and increased its dividend every year for at least 25 consecutive years.
Within this group, we hone it down to 15 stocks which, according to a MarketWatch article, have raised their dividends the most over the last five years.
We then rank these 15 stocks on Dividend Yield, P/E, P/S, and Free Cash Flow Yield. The rank for each of the three valuations is twofold. The first ranking is outright. For instance, the stock with the lowest P/E will rank first, and so on. The second ranking is statistically based. We determine where each valuation is versus its 10-year range. For example, Williams Sonoma (WSM) has a P/E of 7.08. Its minimum and maximum for the last ten years is 7.08 and 25.69. WSM is at the bottom end of the range. WSM’s P/E is -2.10 standard deviations below its mean and ranks first in this category.
Here is a link to the full SimpleVisor Article For Step-By-Step Screening Instructions.
Here is one of the companies we screened.
AbbVie Inc. (ABBV)
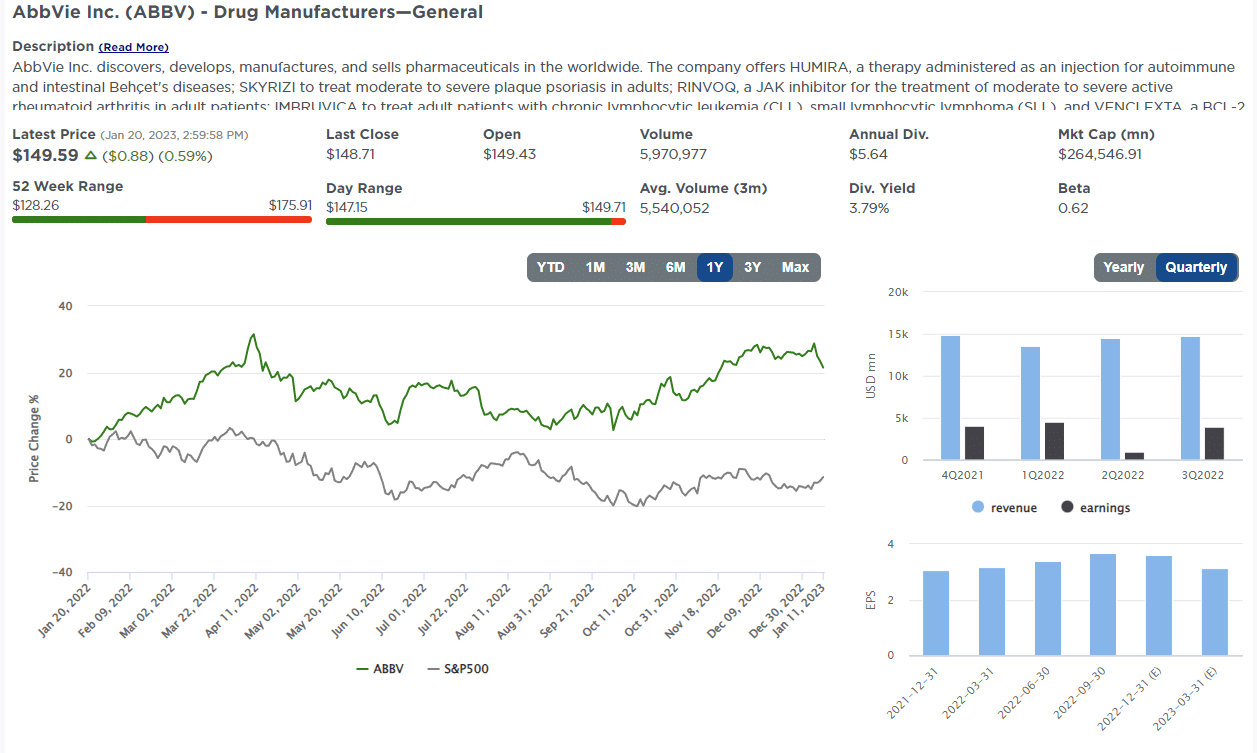
Login to Simplevisor.com to read the full 5-For-Friday report.
Daily Commentary Tidbits
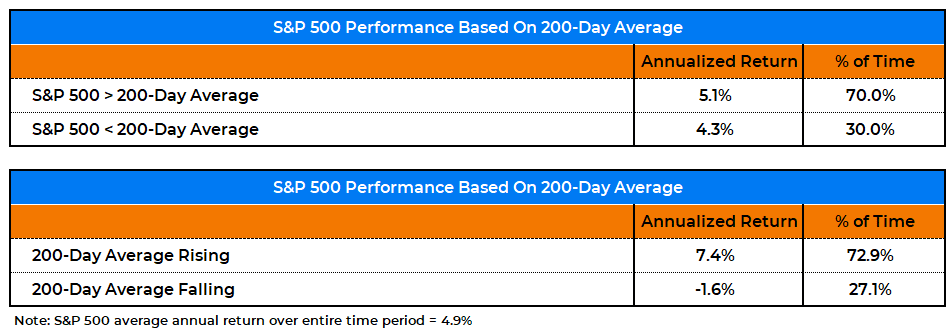
The Slope Of The 200-DMA Matters
The table below shows how the S&P 500 performs relative to its well-followed 200-day moving average (DMA). Many investors like to buy when the index is above the 200DMA and sell below. Based on the table, investors might also want to focus on the DMA’s slope. The graph below the table provides insight into the current situation. As we show, SPY is slightly above the 200DMA, but the moving average is still declining. The 20-day slope of the 200 DMA helps us assess whether the average is flattening and potentially turning higher in the coming days or weeks or picking up speed to the downside. It was flattening from November to early January, but it recently started heading lower again.
Click Here To Read The Latest Daily Market Commentary (Subscribe For Pre-Market Email)
Bull Bear Report Market Statistics & Screens

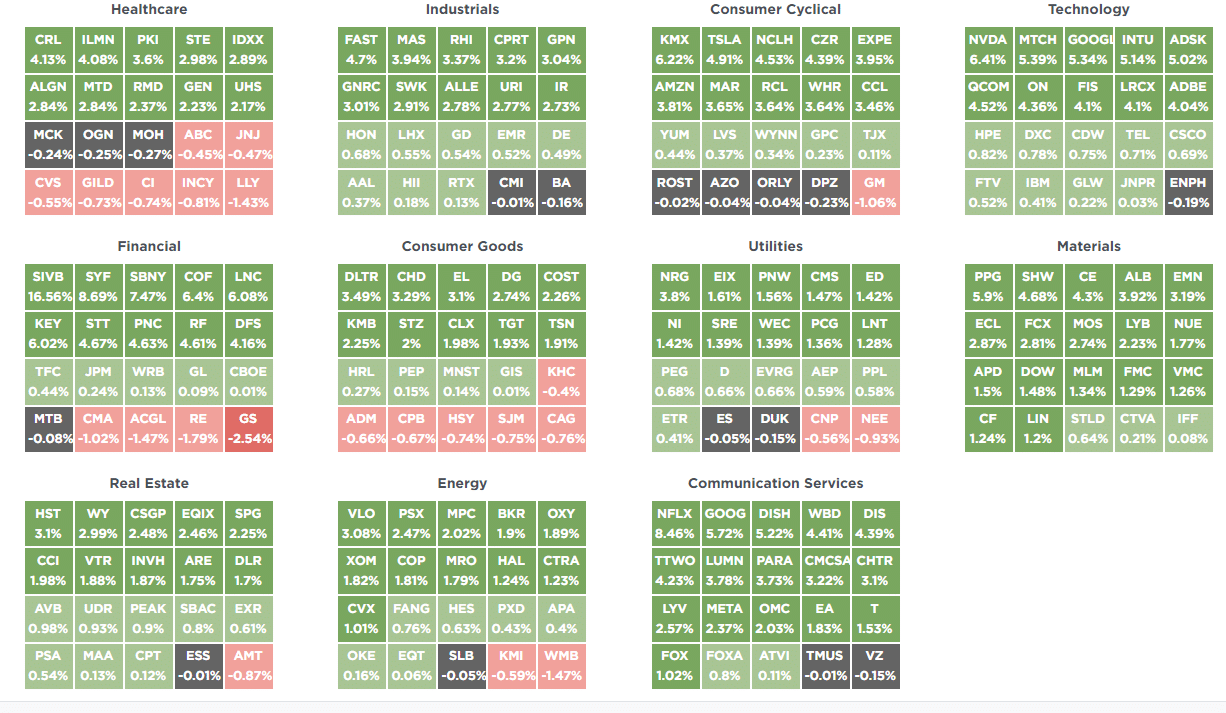
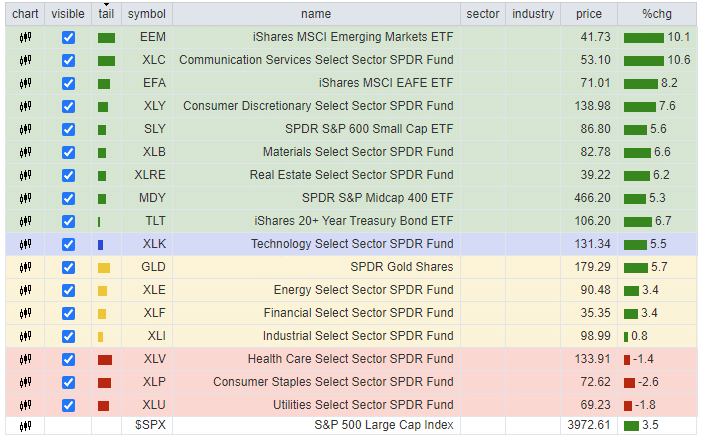
SimpleVisor Top & Bottom Performers By Sector
Broad Market Performance
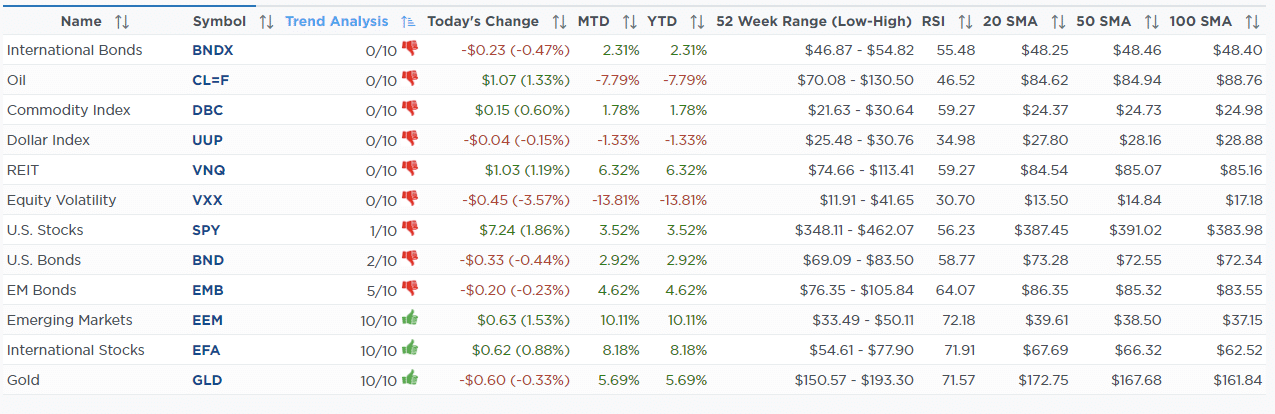
Relative Performance Analysis
As noted last week: “The market is exceptionally overbought short-term so expect some profit-taking next week and a bit more sloppy trading action.” The mid-week sell-off did not revert much of the overbought condition, and Communications, International, and Emerging Markets are well deviated above their moving averages. The outperformance is beginning to wane, so look for a rotation towards laggards. Also, while still hated, technology has been improving technically as of late.
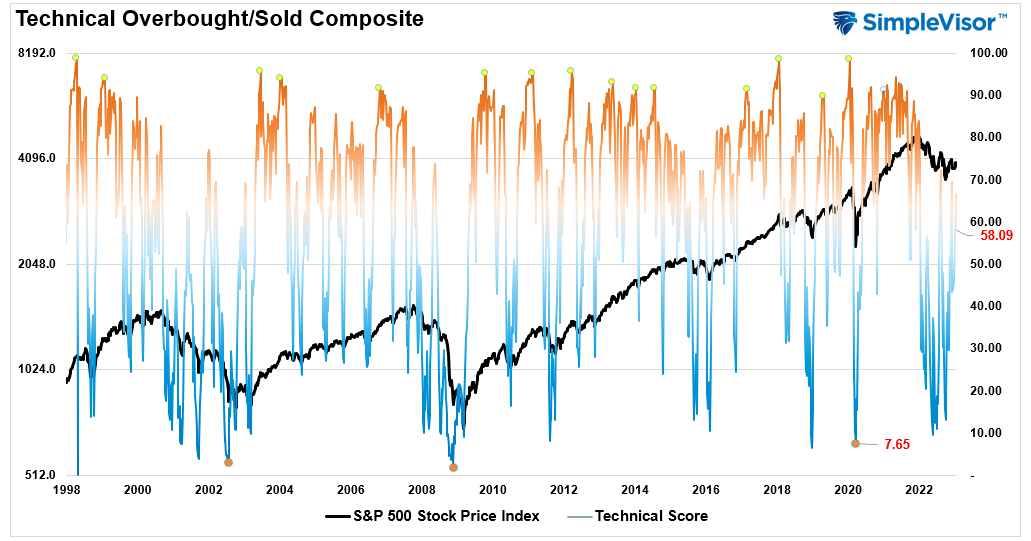
Technical Composite
The technical overbought/sold gauge comprises several price indicators (RSI, Williams %R, etc.), measured using “weekly” closing price data. Readings above “80” are considered overbought, and below “20” are oversold. Markets tend to peak when those readings are at 80 or above, which suggests profit-taking and risk management are prudent. The best buying opportunities exist when those readings are 20 or below.
The current reading is 58.09 out of a possible 100 and rising. Remain long equities for now.
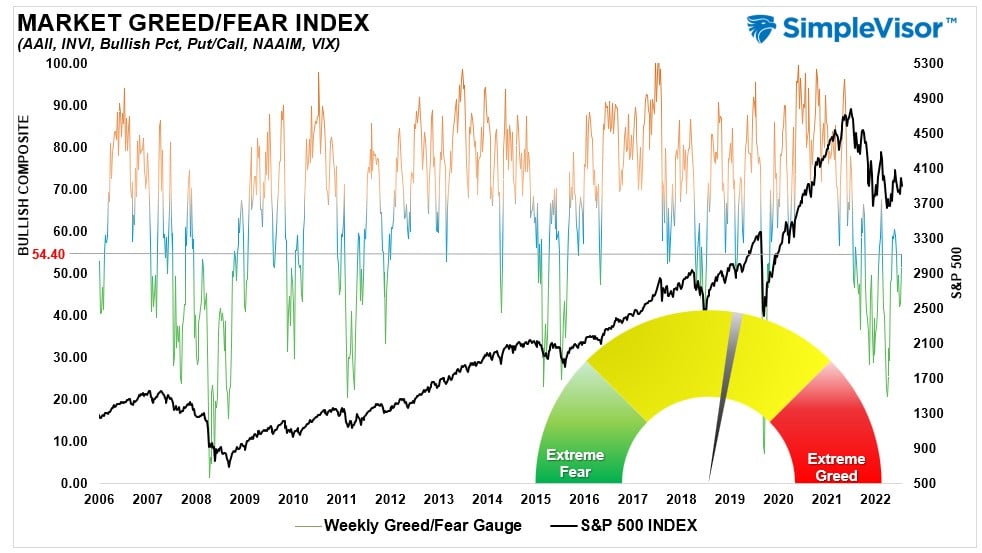
Portfolio Positioning “Fear / Greed” Gauge
The “Fear/Greed” Gauge is how individual and professional investors are “positioning” themselves in the market based on their equity exposure. From a contrarian position, the higher the allocation to equities, the more likely the market is closer to a correction than not. The gauge uses weekly closing data.
NOTE: The Fear/Greed Index measures risk from 0 to 100. It is a rarity that it reaches levels above 90. The current reading is 54.40 out of a possible 100.
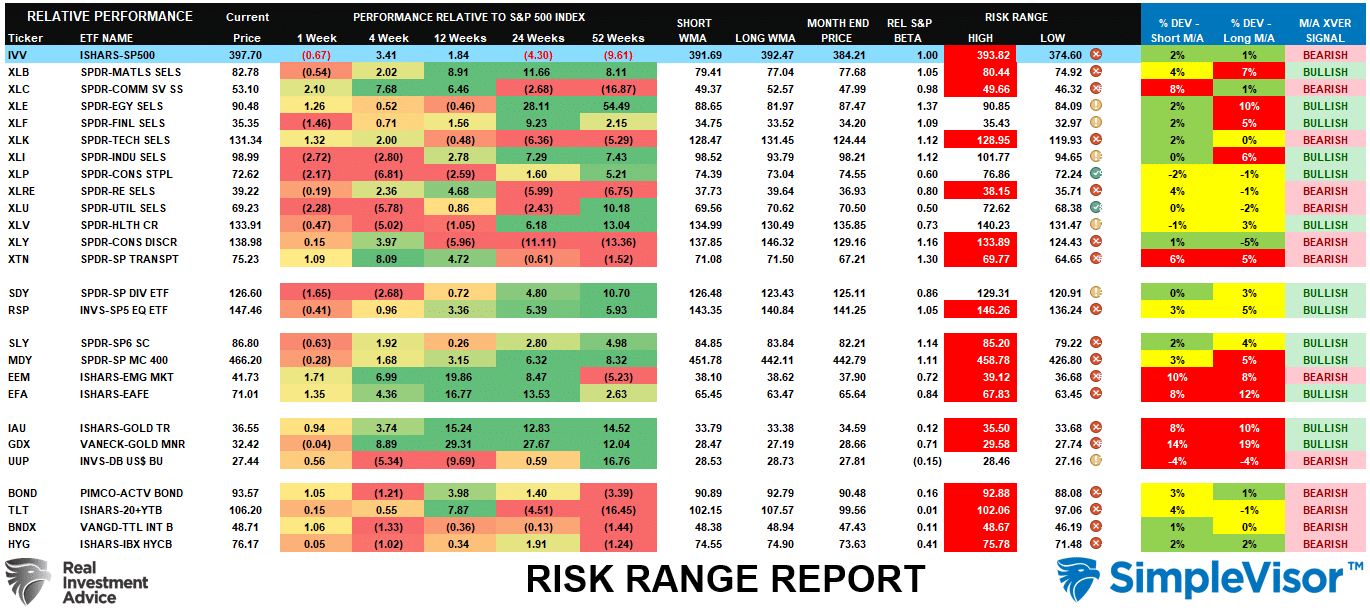
Sector Model Analysis & Risk Ranges
How To Read This Table
- The table compares the relative performance of each sector and market to the S&P 500 index.
- “M” XVER” “Moving Average Cross Over) is determined by the short-term weekly moving average crossing positively or negatively with the long-term weekly moving average.
- The risk range is a function of the month-end closing price and the “beta” of the sector or market. (Ranges reset on the 1st of each month)
- The table shows the price deviation above and below the weekly moving averages.
As noted last week, “The winning streak continued this past week. However, almost every sector and market is now well outside their monthly historical trading ranges. Look for some profit-taking next week as earnings season kicks off.” That sell-off came mid-week but regained most losses by Friday’s close. Despite the short-term volatility, the bullish backdrop remains with numerous sectors and markets back on intermediate-term weekly “buy signals.” Look for pullbacks in areas where you want to add exposure and “buy dips” accordingly.
Weekly SimpleVisor Stock Screens
Each week we will provide three different stock screens generated from SimpleVisor: (RIAPro.net subscribers use your current credentials to log in.)
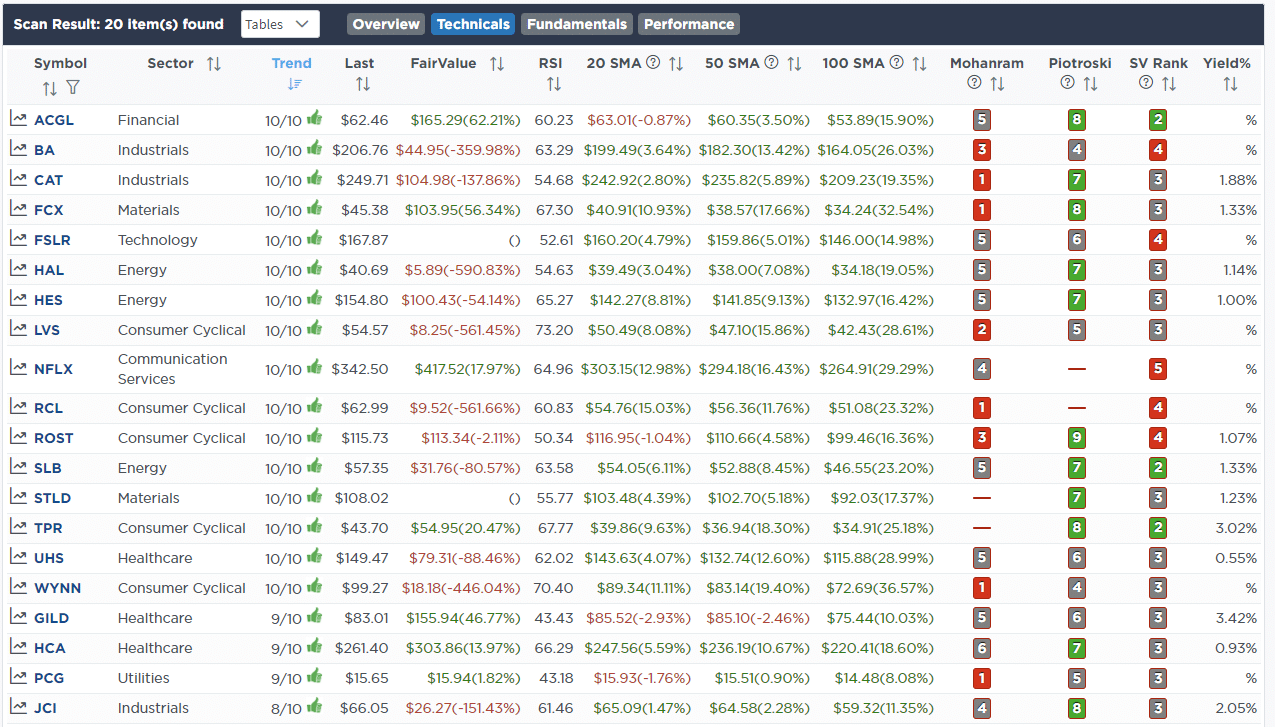
This week we are scanning for the Top 20:
- Relative Strength Stocks
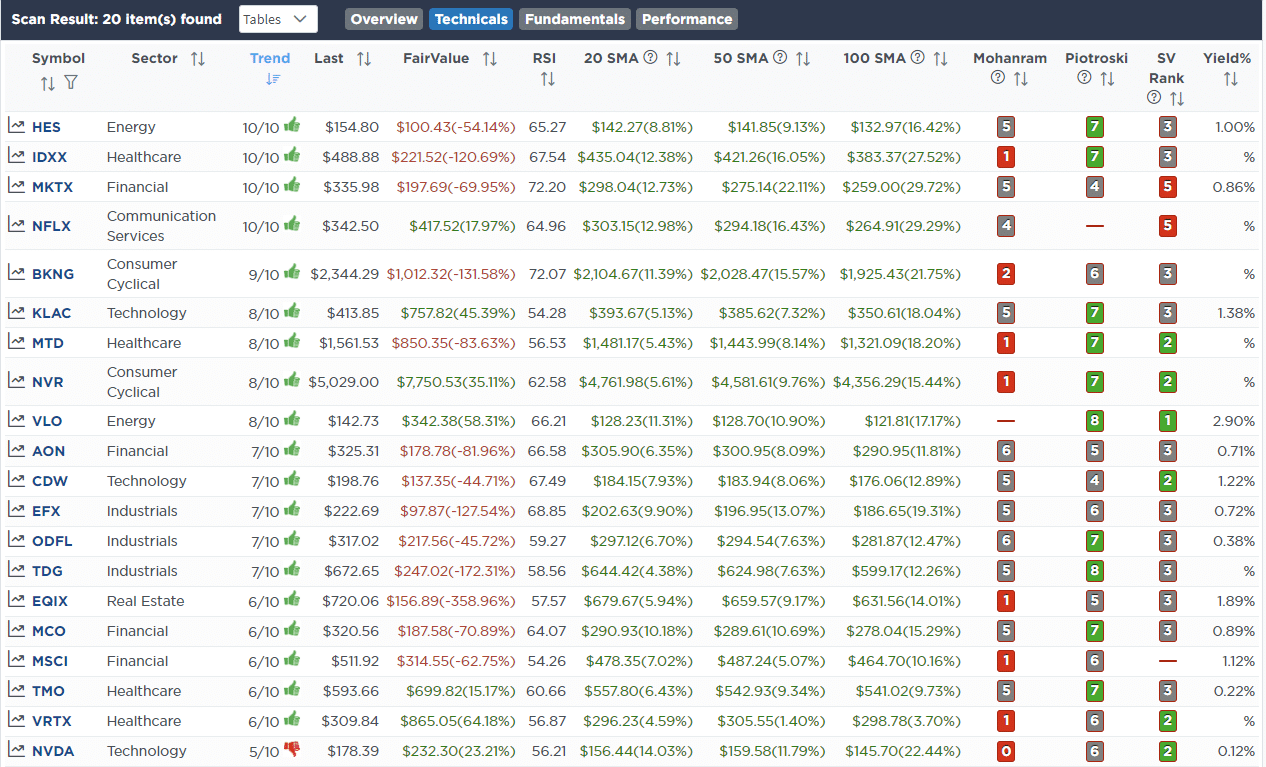
- Momentum Stocks
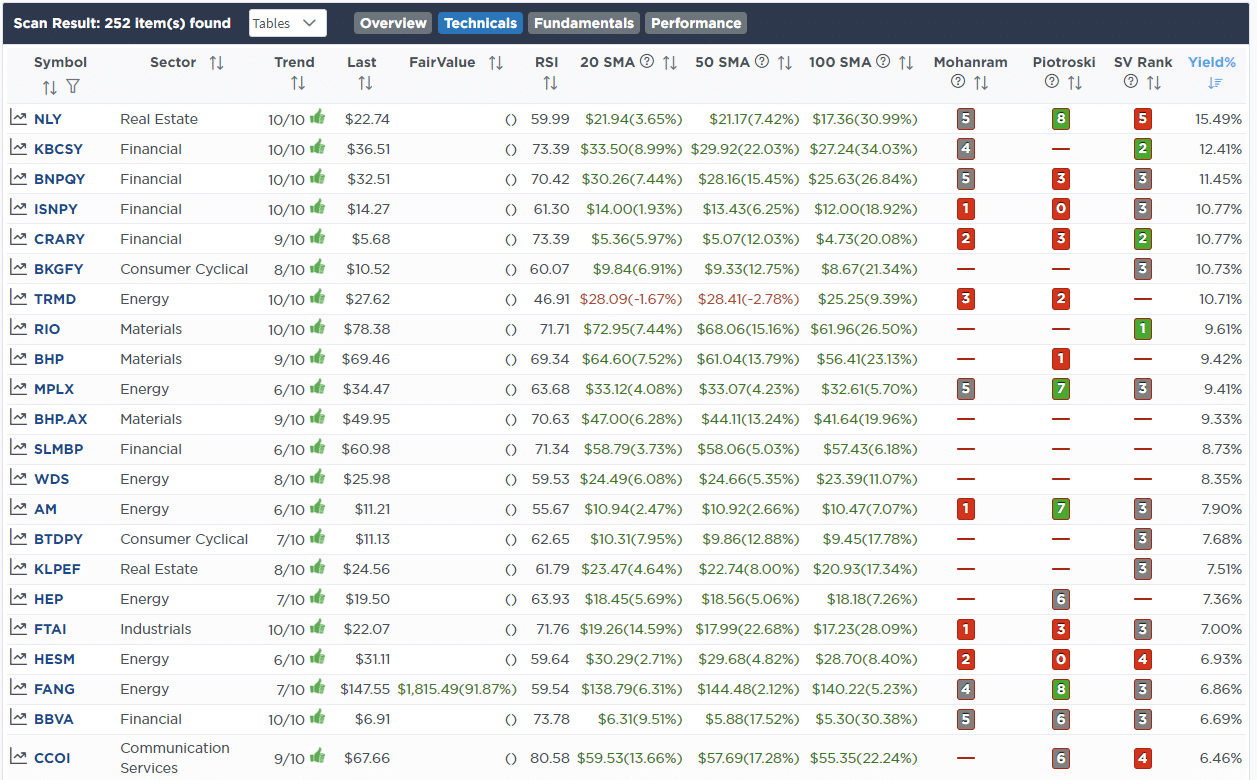
- Highest Rated Stocks With Dividends
These screens generate portfolio ideas and serve as the starting point for further research.
(Click Images To Enlarge)
RSI Screen
Momentum Screen
Highest Rated Stocks With Dividends
SimpleVisor Portfolio Changes
We post all of our portfolio changes as they occur at SimpleVisor:
January 17th
This morning we added 1% to United Healthcare (UNH) in the equity model, increasing the total position size to 3.5% of the portfolio. UNH is very oversold and starting to turn up on its technical indicators. We continue to like the healthcare sector long-term and UNH is oversold relative to its sector.
- Increase United Healthcare (UNH) to 3.5% of the portfolio
January 19th
“This morning we are executing a few trades to start rebalancing the portfolio for what we see as a more challenging market this year. As noted last year, as the Fed hikes rates, they will “break something,” leading to a policy reversal at some point.
Therefore, we are starting to shift our bond portfolio to a bit longer bond duration, which will take advantage of falling rates as the recession sets in later this year.
This morning we added 2% MO to the equity model and 2% of TFLO to both models. We also increased TLT in onboarding portfolios from 5% to 7.5%.
Our game plan is to replace some of our current equity holdings with value/dividend plays. We are buying Altria (MO) today and will likely ultimately sell Goldman Sachs (GS) or something else in its place.
TFLO is just an initial position to capture higher yields and add a little duration. We will continue adding to our bond holdings on pullbacks to support across durations of 3-20 years.”
Equity Model
- Sell 2% of the Floating Rate Treasury ETF (TFLO).
- Buy 2% of the 1-3 Year T-Bill ETF (SHY)
- Buy 2% of the portfolio into Altria Group (MO).
ETF Model
- Sell 2% of the Floating Rate Treasury ETF (TFLO).
- Buy 2% of the 1-3 Year T-Bill ETF (SHY)

Lance Roberts, CIO
Have a great week!


Lance Roberts is a Chief Portfolio Strategist/Economist for RIA Advisors. He is also the host of “The Lance Roberts Podcast” and Chief Editor of the “Real Investment Advice” website and author of “Real Investment Daily” blog and “Real Investment Report“. Follow Lance on Facebook, Twitter, Linked-In and YouTube
Customer Relationship Summary (Form CRS)