


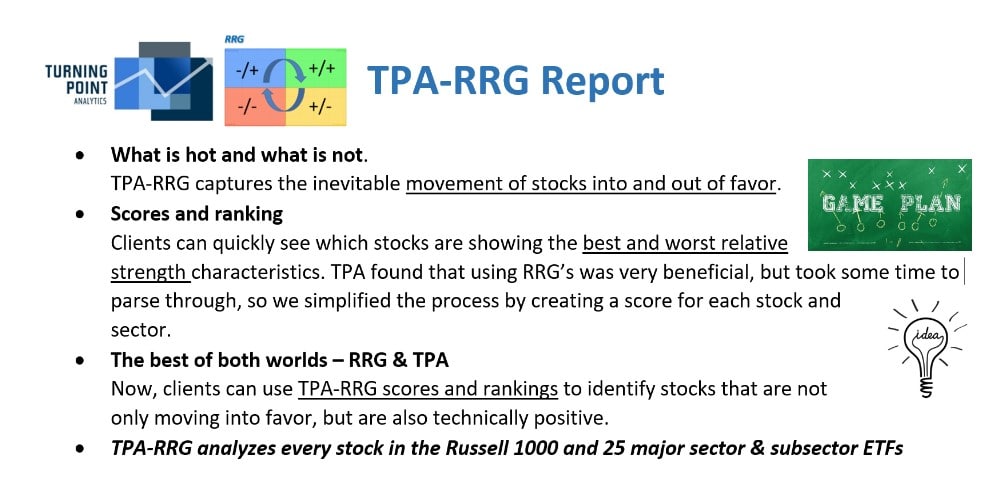
Click on either image below for the entire TPA-RRG Report!
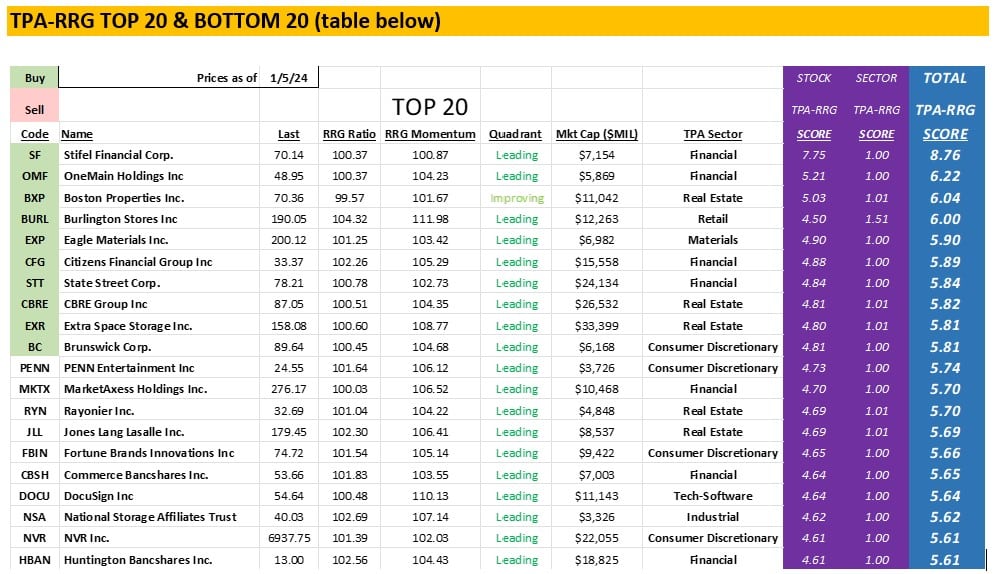
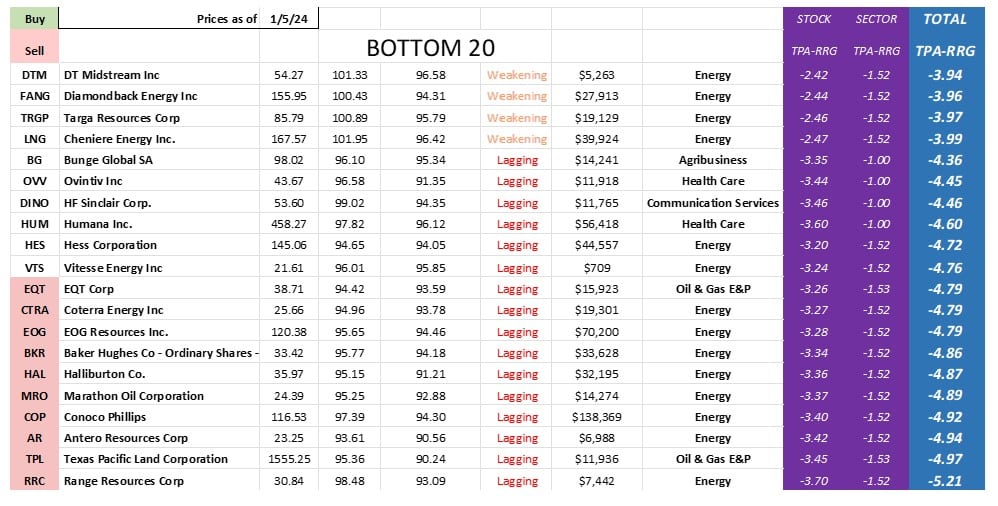
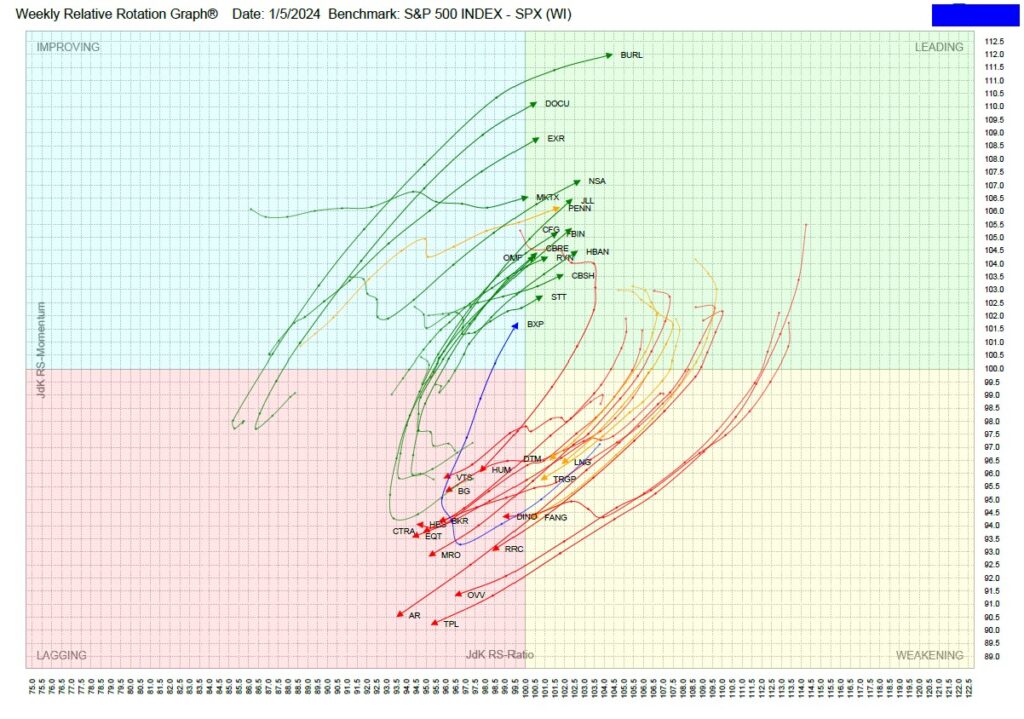
Top 20-Bottom 20 & Sectors
Energy stocks continue to predominate the Bottom 20….
The bottom 3 sectors remain all energy.
Let’s look at the charts below. Crude broke down below its long-term uptrend in 2022. Since then, Crude has been in a range of 68 to 92. Technically, the most probable fallout is an eventual break of support at 68. That break will put further pressure on Energy stocks (charts 1 and 2).
Charts 3 and 4 show that Energy sectors have really outperformed over the past 3 years the Energy ETFs – XLE +141%, OIH +87%, and XOP +133% compared to SPY up only 26%. This sets up the potential for long-term underperformance. Crude’s underperformance should continue to put pressure on Energy stocks. Chart 4 shows that there is also a safety factor associated with Energy stocks. Note that recent declines in Energy stocks was associated with stocks rallies. So, if Crude falls and stocks rally there will be 2 reasons for Energy stocks to fall.


Jeff Marcus founded Turning Point Analytics (TPA) in 2009 after 25 years on trading desks and 13 years as a head trader to provide strategic and technical research to institutional clients. Turning Point Analytics (TPA) provides a unique strategy that works as an overlay to clients’ good fundamental analysis. After 10 years of serving only large institutions, TPA now offers its research services to mid and small managers, RIA’s, and wealthy sophisticated individuals looking for a way to increase their returns and outperform their peers.
Subscribe 2 Week Trial
Customer Relationship Summary (Form CRS)