
FTNT-negative
Written by Jeffrey Marcus | Oct 25, 2022 | TPA Plus - Trend RangeFTNT broke down below its 12-month uptrend line in December 2022 after rallying over 220%…
> Read More
FTNT broke down below its 12-month uptrend line in December 2022 after rallying over 220%…
> Read More
Click the image below for the full report with all of the charts….
> Read More
There are few scars as deep and long-lasting for homeowners or anyone involved in the…
> Read More
Click on either of the images below for the complete report….
> Read More
Click on the image below for the complete report with all 20 charts….
> Read More
A is down 30% from its September 2021 highs. In July, A rose above its…
> Read More
Click on either image below for the entire report…
> Read More
Click on image below for the full report including all charts.
> Read More
NCNO rose above its 8-month downtrend line in August. The zoom chart reveals that NCNO…
> Read More
Click on the link below for the full report with all charts…
> Read More
Stocks are at an Oversold Extreme The TPA Marketscope shows that stocks are very oversold….
> Read More
Click either image below for the full report…..
> Read More
Click on the image below for the full report with charts….
> Read More
GPS rose above its 15-month downtrend line at the end of July. GPS has declined…
> Read More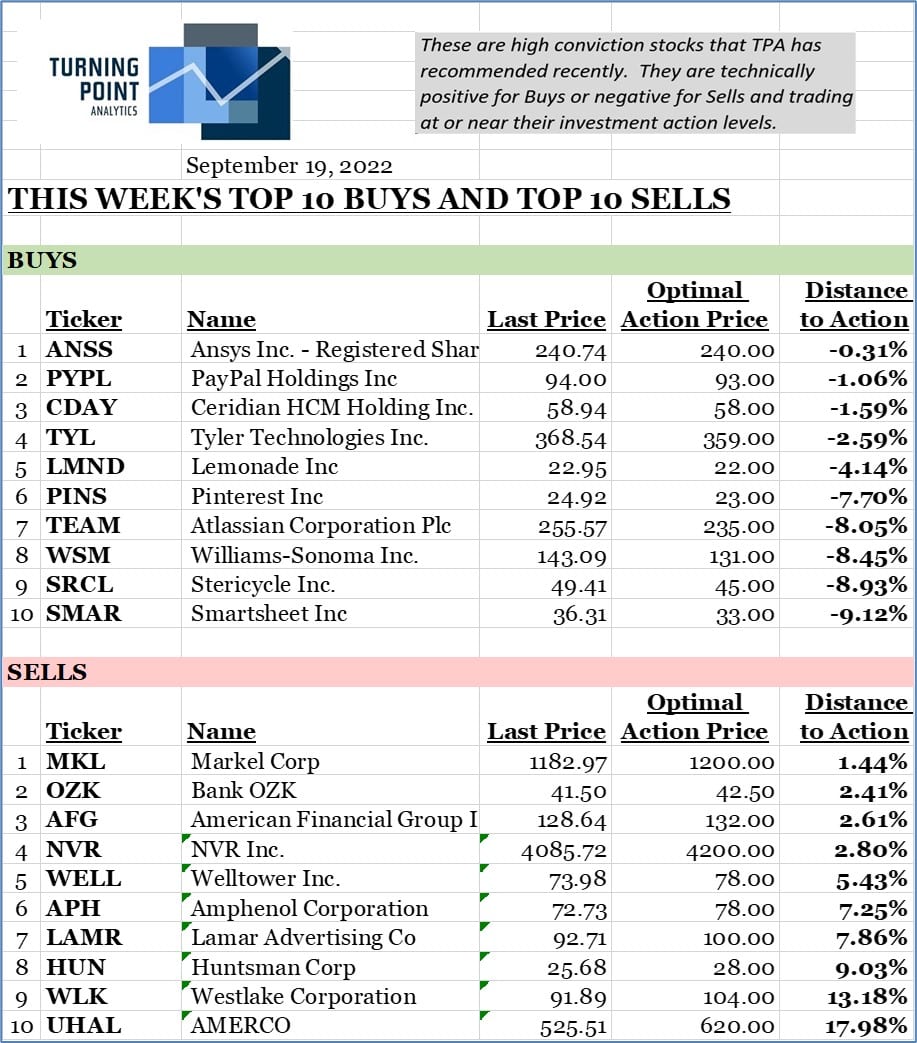
Clcik on the link below for the full report and all charts….
> Read More
SRCL rose above its 15-month downtrend line in August. The zoom chart reveals that the…
> Read More
PYPL rose above both its 11-month and 7-month downtrend lines in August. The gap higher…
> Read More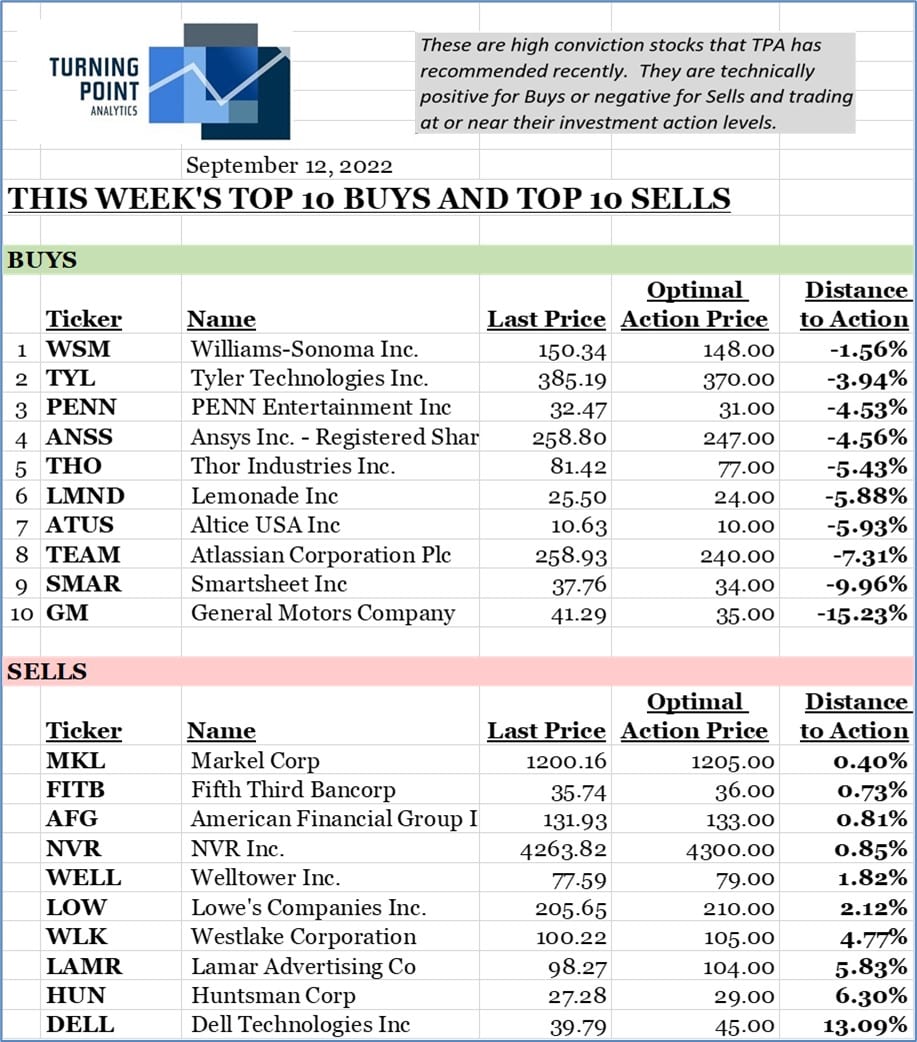
Click on the image below for the full report and all charts….
> Read More
WSM rose above its 8-month downtrend line in July. WSM had declined 54% from the…
> Read More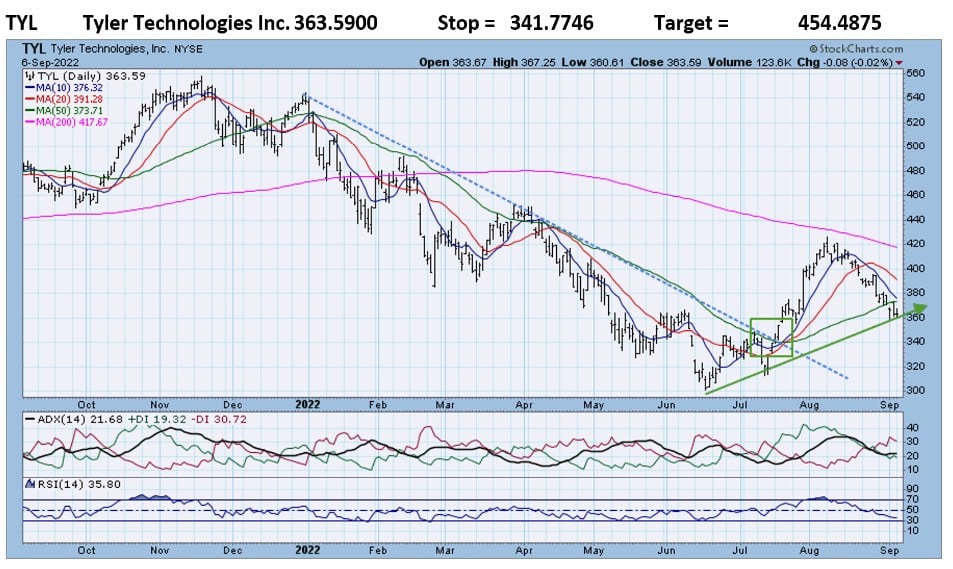
TYL broke out from its 2022 downtrend in July. TYL is now 21% off of…
> Read More
Click on image below for all charts.
> Read More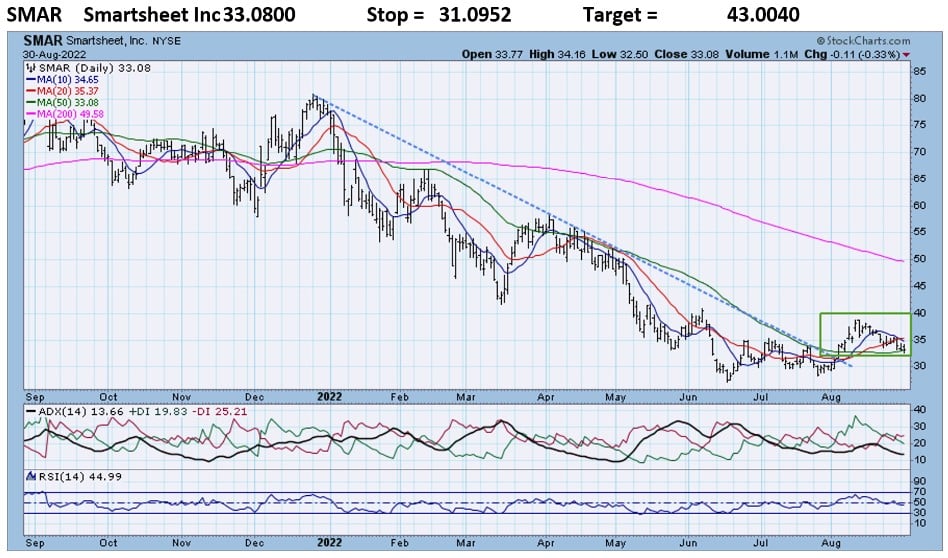
SMAR rose above its 2022 downtrend line in early August. SMAR had declined over 63%…
> Read More
Click on any image for this week’s full report. You can learn more about RRG’s…
> Read More
Click on the image below for the full report with charts…
> Read More
TER rose above its steep, down 45%, 7-month downtrend line in July. Chart 2 reveals…
> Read More
PENN rose above its 8-month downtrend line in June and its 16-month downtrend line in…
> Read More
Click on the image below for the full report with charts
> Read More
ATUS rose above its 10-month downtrend in July. The zoom chart reveals a very positive…
> Read More
TPA Marketscope is showing conflicting alerts. The percent of Russell 1000 stocks trading above their…
> Read More
Click image below for the full report with charts.
> Read More